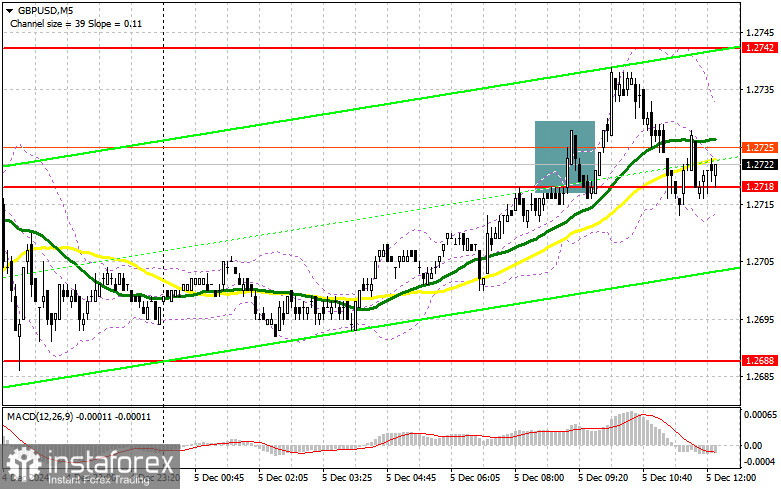
In my morning forecast, I identified the 1.2718 level as a key area for market entry decisions. An analysis of the 5-minute chart reveals that a rise and subsequent false breakout at this level provided a favorable selling opportunity. However, the anticipated downward movement did not occur, resulting in losses. The technical outlook has been updated for the second half of the day.

To Open Long Positions on GBP/USD:
The pound's reaction to strong UK construction sector PMI data undermined the initial strategy for selling GBP/USD. However, as the chart shows, buyers have not fully seized control, even though the pair is now trading above 1.2718. Further movements will depend on U.S. initial jobless claims and trade balance data. Mediocre statistics may renew demand for the pound.
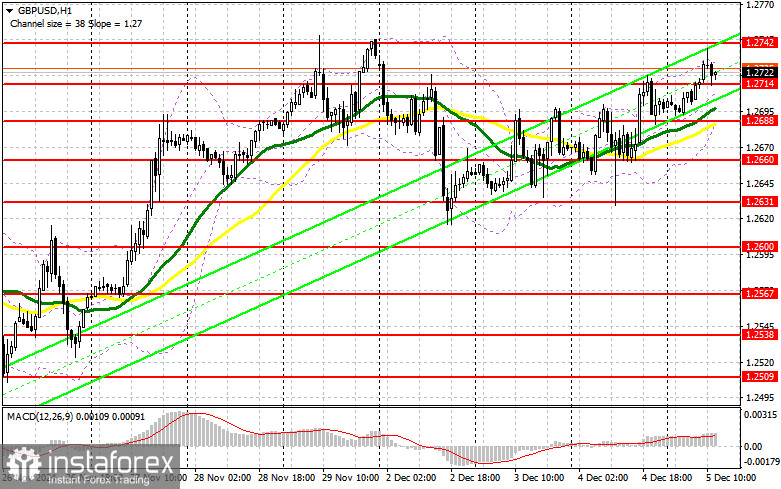
Maintaining the 1.2714 support will be crucial for buyers. If GBP/USD falls, a false breakout at this level will provide an opportunity to open long positions, targeting the 1.2742 resistance level, which narrowly avoided being tested earlier today. A breakout and subsequent retest from top to bottom will validate further gains toward 1.2770. The ultimate target is 1.2800, a key profit-taking area.
If GBP/USD declines without significant bullish activity at 1.2714, bears may gain the upper hand, increasing the likelihood of a deeper drop. A false breakout at 1.2688 would then be a favorable condition for opening long positions. Alternatively, I will consider buying GBP/USD on a rebound from the 1.2660 low, targeting an intraday correction of 30–35 points.
To Open Short Positions on GBP/USD:
Strong U.S. labor market statistics may renew pressure on the pound. However, traders are likely to remain cautious ahead of tomorrow's non-farm payrolls report. Holding the 1.2742 resistance level is critical for sellers. A false breakout at this level will provide an opportunity to open short positions, targeting the 1.2714 support level, where moving averages currently favor buyers. A breakout and retest from below could clear stop orders, paving the way toward 1.2660. The ultimate target is 1.2631, a potential profit-taking area.
If the pound continues to rise following weak U.S. data and there is no bearish activity at 1.2742, buyers will likely establish a bullish trend. Sellers may then retreat to the 1.2770 resistance zone, where short positions will only be considered after a false breakout. In the absence of downward momentum at that level, I will look for selling opportunities on a rebound from 1.2800, targeting a downward correction of 30–35 points.

Commitments of Traders (COT) Report
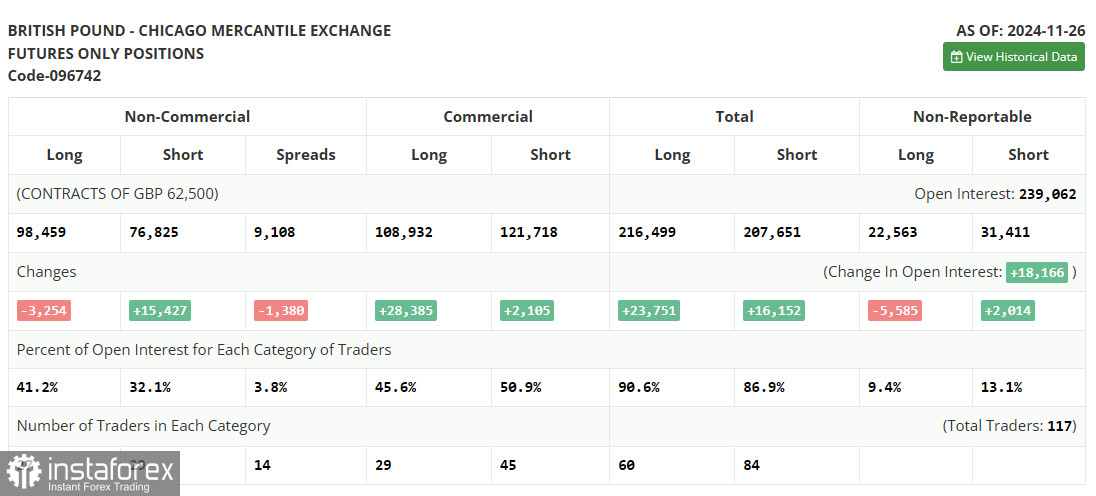
The November 26 COT report highlighted a decrease in long positions and a sharp increase in shorts, reflecting growing bearish sentiment toward the pound.
Key Points:
- Long positions decreased by 3,254 to 98,459 positions.
- Short positions increased by 15,427 to 76,825 positions.
- The net difference between long and short positions narrowed by 1,380.
The Bank of England's cautious stance on further interest rate cuts is working against pound buyers. This typically hawkish behavior would generally strengthen the currency under normal conditions. However, very weak economic indicators, along with rising inflation and potential U.S. trade tariffs, are adding to bearish pressure on the pound. Concerns over a possible UK recession next year are further undermining investor confidence.

Indicator Signals
Moving Averages
Trading above the 30- and 50-day moving averages indicates the potential for further growth in GBP/USD.
Note: Moving average periods and prices are based on the author's H1 hourly chart and may differ from interpretations on the D1 daily chart.
Bollinger Bands
In case of a decline, the lower band of the Bollinger Bands indicator near 1.2688 will act as support.
Indicator Descriptions
- Moving Average (MA): Identifies trends by smoothing out volatility and noise.
- Period – 50 (yellow on the chart)
- Period – 30 (green on the chart)
- MACD (Moving Average Convergence/Divergence): Measures the convergence/divergence of moving averages.
- Fast EMA – 12
- Slow EMA – 26
- Signal SMA – 9
- Bollinger Bands: Measures price volatility and identifies potential support/resistance levels.
- Period – 20
- Non-commercial traders: Speculators, such as hedge funds and large institutions, using the futures market for speculative purposes.
- Long non-commercial positions: The total long positions held by non-commercial traders.
- Short non-commercial positions: The total short positions held by non-commercial traders.
- Net non-commercial position: The difference between short and long positions held by non-commercial traders.
 English
 Русский
 Bahasa Indonesia
 Bahasa Malay
 ไทย
ไทย Español
 Deutsch
 Български
 Français
 Tiếng Việt
 中文
中文 বাংলা
বাংলা हिन्दी
 Čeština
 Українська
 Română

