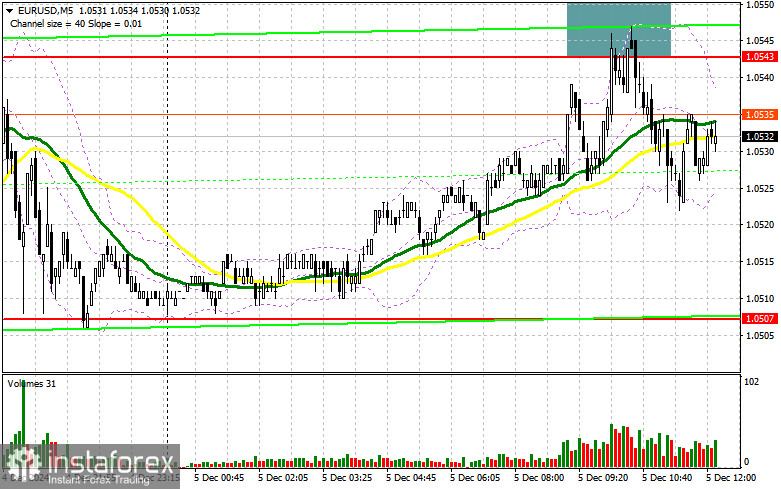
In my morning forecast, I identified the 1.0543 level as a key area for market entry decisions. A review of the 5-minute chart shows that a rise and subsequent false breakout near this level provided an excellent entry point for selling, leading to a 20-point decline in the pair. The technical picture for the second half of the day remains unchanged.

To Open Long Positions on EUR/USD:
The euro's decline following weaker-than-expected eurozone retail sales data was expected. However, buyers managed to hold their ground, keeping the market relatively stable. In the second half of the day, attention will shift to U.S. initial jobless claims and trade balance data. Weekly labor market figures are expected to remain within average ranges, reducing the likelihood of significant market swings. However, if the report is much stronger than expected, renewed pressure on the euro is likely, which I plan to take advantage of.
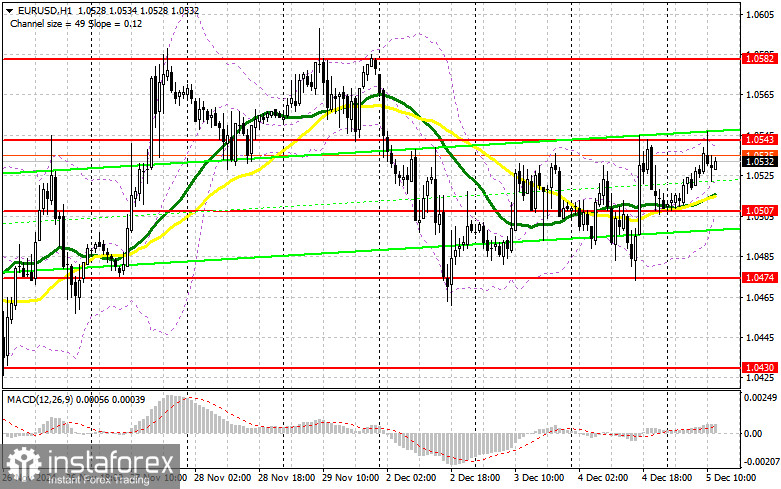
My focus will be on the support level at 1.0507, established during yesterday's trading. A false breakout at this level will provide favorable conditions for opening long positions, targeting the 1.0543 level. A break and subsequent test of this range from top to bottom will validate the entry point for further purchases, with the next target at 1.0582. The ultimate goal will be the 1.0616 high, where I plan to take profits. Testing this level could reignite bullish sentiment for the euro.
If EUR/USD declines and shows no significant activity near 1.0507, selling pressure on the pair will likely increase, raising the chances of a deeper drop toward the lower boundary of the consolidation range. In this case, I will only act after a false breakout near the 1.0474 level. Alternatively, I plan to open long positions on a rebound from 1.0430, aiming for an intraday correction of 30–35 points.
To Open Short Positions on EUR/USD:
If U.S. data is weak and the pair rises, sellers will need to defend the resistance at 1.0543, which remains their primary task in the second half of the day. A false breakout at this level will provide a good entry point for short positions, targeting the 1.0507 support level, where moving averages favor sellers. Breaking and consolidating below this range, followed by a retest from below, will confirm the bearish scenario and aim for the next target at 1.0474. The ultimate target will be the 1.0430 area, where I plan to take profits.
If EUR/USD rises in the second half of the day and bears fail to act near 1.0543—a plausible scenario—I will delay selling until the next resistance at 1.0582. I will consider selling at this level but only after an unsuccessful attempt to consolidate above it. Additionally, I plan to open short positions on a rebound from 1.0616, targeting a downward correction of 30–35 points.

Commitments of Traders (COT) Report
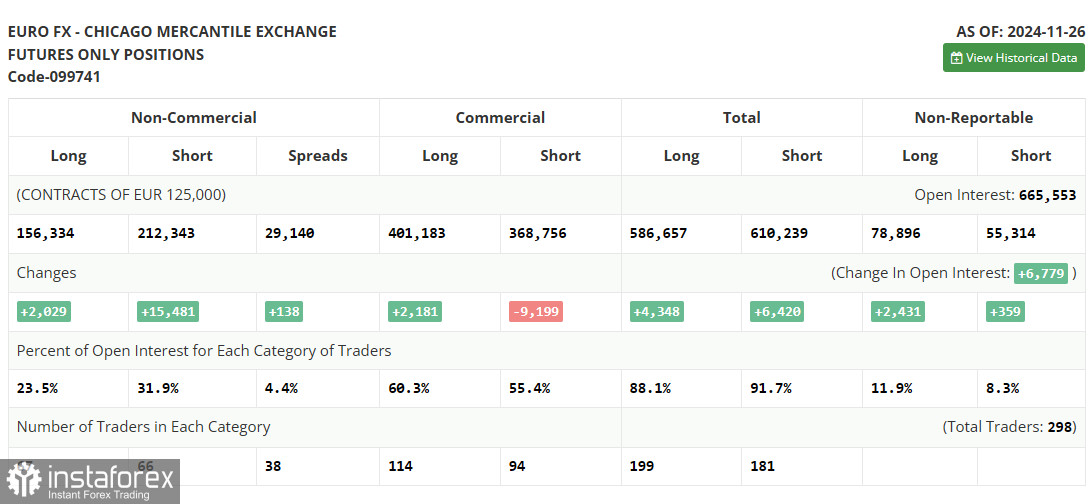
The November 26 COT report showed a significant increase in short positions and a slight rise in long positions. The Federal Reserve's cautious stance on interest rate cuts continues to make the U.S. dollar more attractive compared to risk assets such as the euro. Furthermore, with Trump yet to take office but already proposing trade tariffs—including a recent 100% tariff for BRICS countries—investor and trader sentiment has shifted further toward the dollar.
The COT report highlighted the following:
- Long positions increased by 2,029 positions to 156,334.
- Short positions grew by 15,481 positions to 212,343.
- The net gap between long and short positions widened by 138 positions, emphasizing growing bearish sentiment.

Indicator Signals
Moving Averages
Trading is currently above the 30- and 50-day moving averages, indicating the euro's attempt to sustain upward momentum.
Note: The moving average periods and prices referenced are based on the author's H1 hourly chart and may differ from classic daily (D1) chart interpretations.
Bollinger Bands
The lower band of the Bollinger indicator at 1.0507 will serve as support in the event of a decline.
Indicator Descriptions
- Moving Average (MA): Identifies the current trend by smoothing out price volatility and noise.
- Period – 50 (yellow on the chart)
- Period – 30 (green on the chart)
- MACD (Moving Average Convergence/Divergence): Measures the convergence/divergence of moving averages.
- Fast EMA – 12
- Slow EMA – 26
- Signal SMA – 9
- Bollinger Bands: Measures price volatility and identifies support/resistance levels.
- Period – 20
- Non-commercial traders: Speculators, including individual traders, hedge funds, and large institutions, who use the futures market for speculative purposes.
- Long non-commercial positions: The total long positions held by non-commercial traders.
- Short non-commercial positions: The total short positions held by non-commercial traders.
- Net non-commercial position: The difference between short and long positions held by non-commercial traders.
 English
 Русский
 Bahasa Indonesia
 Bahasa Malay
 ไทย
ไทย Español
 Deutsch
 Български
 Français
 Tiếng Việt
 中文
中文 বাংলা
বাংলা हिन्दी
 Čeština
 Українська
 Română

