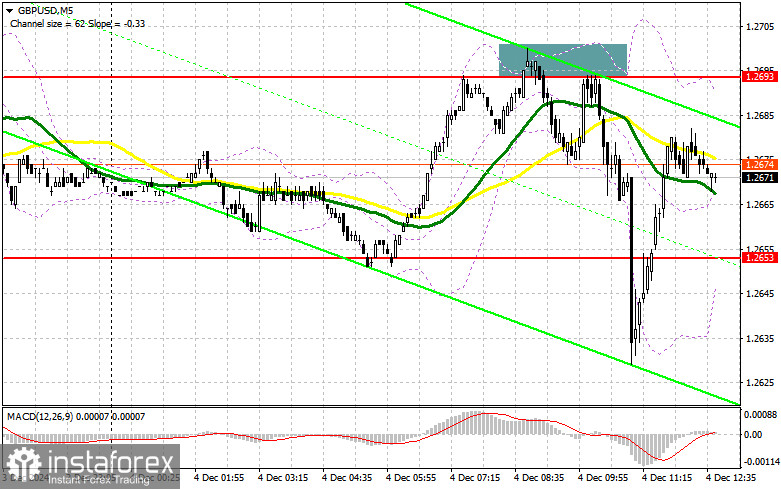
In my morning forecast, I identified the 1.2693 level as a key decision point for market entries. Let's analyze the 5-minute chart to understand what happened. An increase followed by a false breakout at this level created an excellent selling opportunity, resulting in a drop of over 50 points. The technical outlook has been updated for the second half of the day.

To Open Long Positions on GBP/USD:
Despite some resilience in the UK services sector, the data did not meet traders' expectations. However, another attempt to push the pound lower was quickly bought, maintaining the possibility of a recovery later in the day. The US PMI data for the services and composite indices for November, along with the ADP Employment Change report, will play a crucial role. Only strong data will trigger another sell-off in GBP/USD. Otherwise, further gains for the pound may follow. Jerome Powell's speech, as Chair of the Federal Reserve, will be a key event, given it is one of the final statements before the Fed's December meeting.
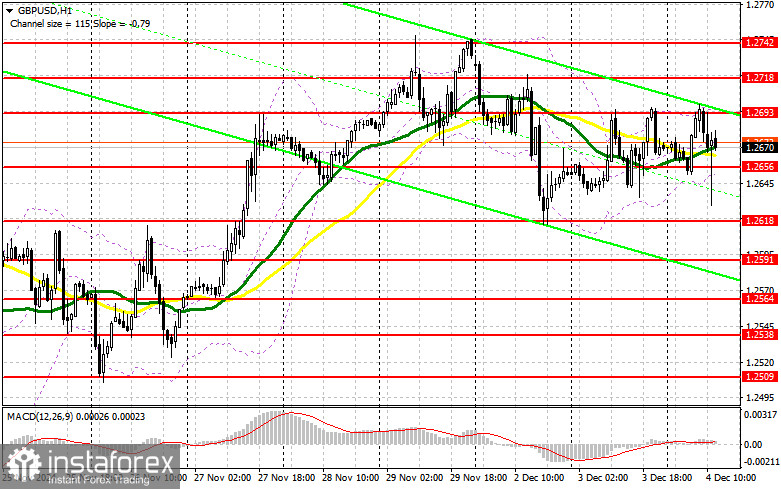
If GBP/USD declines, I plan to act after observing a false breakout near the 1.2656 support level, formed during the first half of the day. The initial target is the 1.2693 area, where buyers struggled earlier. A second rise to this level, followed by a breakout and a retest from above, will offer a new entry point for long positions, aiming to update 1.2718. The ultimate target is the 1.2742 zone, where I plan to secure profits.
If GBP/USD drops and there is no bull activity at 1.2656, bears will likely take advantage of the opportunity for a deeper sell-off. I will only consider buying after a false breakout near the 1.2618 support level. Alternatively, I will buy immediately on a rebound from the 1.2591 low, targeting an intraday correction of 30–35 points.
To Open Short Positions on GBP/USD:
Pressure on the pound could return at any moment, particularly with strong US labor market data, although this seems unlikely. Short positions will be considered only after observing a false breakout near 1.2693, as detailed earlier. This will offer a selling opportunity with a target at the 1.2656 support level, where moving averages converge. A breakout and retest from below will trigger stop orders, paving the way toward 1.2618. The ultimate target is the 1.2591 zone, where I plan to secure profits.
If demand for the pound persists after weak US data and there is no bear activity at 1.2693, buyers will likely continue driving the recovery. In that case, bears will retreat to the 1.2718 resistance area, where I will sell only after a false breakout. If no downward movement occurs even there, I will look for short positions on a rebound from 1.2742, targeting a 30–35 point downward correction.

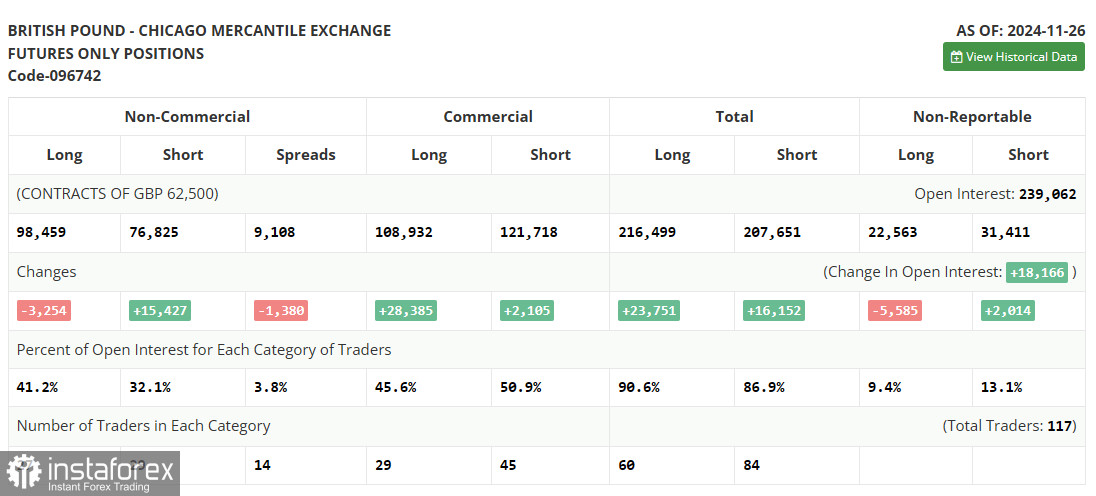
COT Report Analysis:The Commitment of Traders (COT) report for November 26 indicated a reduction in long positions and a sharp increase in short positions. The Bank of England's reluctance to continue cutting interest rates currently does not favor pound buyers, even though, in normal circumstances, such a stance would support the national currency. The primary driver behind GBP/USD's decline is weak economic data, which could push the UK economy into recession next year. Rising inflation and anticipated US tariffs further erode confidence among traders and investors.
Key Highlights from the Latest COT Report:
- Long non-commercial positions fell by 3,254 to 98,459.
- Short non-commercial positions rose by 15,427 to 76,825.
- The gap between long and short positions narrowed by 1,380.

Indicator Signals:
- Moving Averages: Trading is occurring near the 30- and 50-period moving averages, reflecting market uncertainty.
- Bollinger Bands: In case of a decline, the lower band at 1.2650 will provide support.
Indicator Descriptions:
- Moving Average (MA): Smooths out volatility and noise to identify trends. Periods: 50 (yellow) and 30 (green).
- MACD Indicator: Tracks the difference between fast EMA (12), slow EMA (26), and signal SMA (9).
- Bollinger Bands: Measures volatility, using a period of 20.
- Non-Commercial Traders: Speculative traders such as individual investors, hedge funds, and large institutions.
- Long Non-Commercial Positions: Total long open positions held by speculative traders.
- Short Non-Commercial Positions: Total short open positions held by speculative traders.
- Net Non-Commercial Position: The difference between short and long speculative positions.
 English
 Русский
 Bahasa Indonesia
 Bahasa Malay
 ไทย
ไทย Español
 Deutsch
 Български
 Français
 Tiếng Việt
 中文
中文 বাংলা
বাংলা हिन्दी
 Čeština
 Українська
 Română

