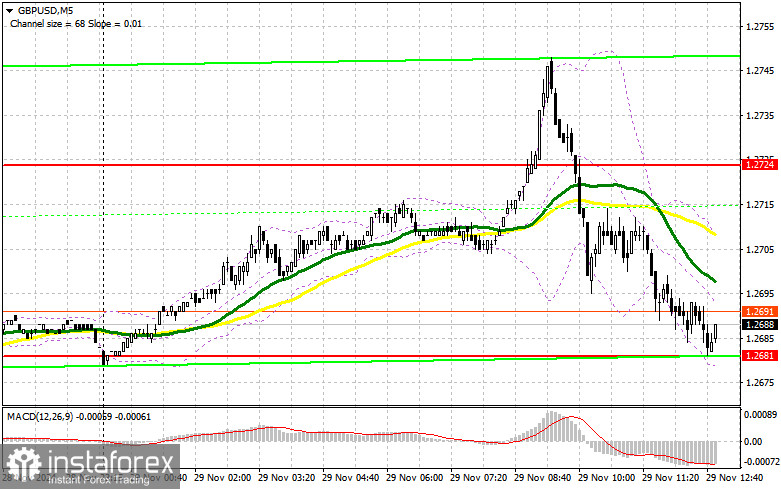
In my morning forecast, I highlighted the 1.2724 level as a key decision point. Let's review the 5-minute chart to analyze what occurred. While there was an upward movement, it did not lead to a retest of 1.2724, leaving no viable entry points. Selling on a false breakout at 1.2724 was also not a feasible option, as the pair had already moved significantly higher after breaching this level. The technical setup for the second half of the day remains unchanged.

For Long Positions on GBP/USD:
The pound attempted to rise even before Bank of England Governor Andrew Bailey's speech but failed to sustain momentum near the new weekly high. As noted in the morning forecast, Bailey's remarks will play a decisive role, and a hawkish tone could support the pound's recovery. Otherwise, downward pressure on the pair is likely to persist. With no U.S. data in the afternoon, significant growth appears unlikely.
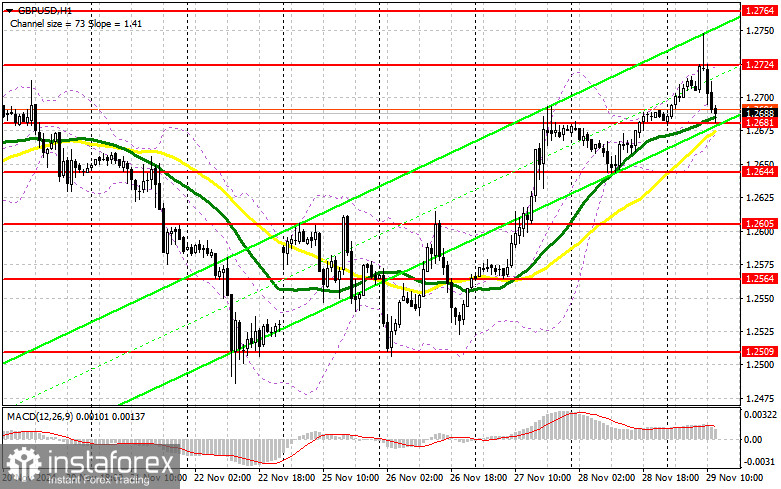
If GBP/USD declines, I will consider entering long positions on a false breakout near the 1.2681 support level, which was established during yesterday's session. The initial target will be the 1.2724 resistance level, which the pair failed to hold earlier today. A breakout and subsequent retest of this range would create a new buying opportunity, with further targets at 1.2764. The final target is 1.2796, where I plan to take profits.
If GBP/USD falls and buyers show no activity near 1.2681, bears may gain control heading into the end of the week. In this case, a false breakout near 1.2644 would provide the only valid signal for long positions. Alternatively, I will look to buy on a direct rebound from 1.2605, targeting an intraday upward correction of 30–35 points.
For Short Positions on GBP/USD:
Downward pressure on the pound may reemerge at any moment, particularly if Governor Bailey adopts a dovish tone. A false breakout near 1.2724 would confirm a selling signal, targeting the 1.2681 support level. This level aligns with moving averages, which currently favor the bulls. Breaking and retesting this range from below would trigger stops, opening the way toward 1.2644. The final target is 1.2605, where I plan to take profits.
If GBP/USD rises and bears show no activity near 1.2724—which seems unlikely at the end of the month—sellers will likely retreat to the 1.2764 resistance level. I will sell there only after a false breakout. If the pair fails to move lower from that level, I will consider short positions on a rebound near 1.2796, targeting a 30–35 point downward correction.

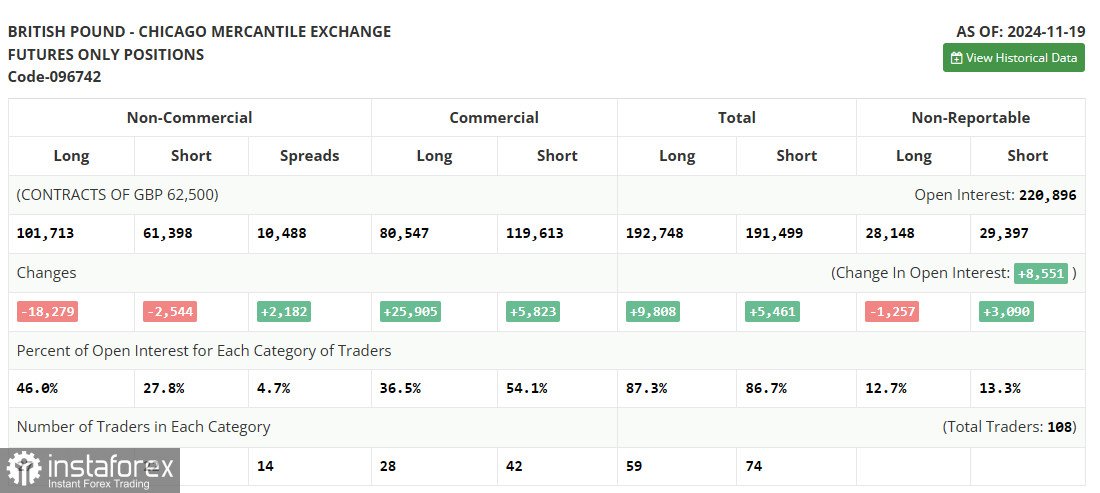
The Commitments of Traders (COT) report for November 19 showed reductions in both long and short positions. Current figures already reflect Donald Trump's presidency, but the Bank of England's apparent decision to pause rate cuts—despite conflicting with government growth targets—has not yet been fully priced in. Recent PMI data suggest that achieving these growth targets may prove challenging. Traders have responded by reducing exposure to the pound. However, there has been no notable increase in selling interest, which could signal a slowdown in the bearish trend.
According to the latest COT report, long non-commercial positions fell by 18,279 to 101,713, while short non-commercial positions dropped by 2,544 to 61,398. As a result, the net position spread widened by 2,182 contracts.

Indicator Signals:
Moving Averages:Trading above the 30- and 50-day moving averages signals an ongoing upward correction.(Note: These averages are based on the H1 chart and differ from the D1 daily averages.)
Bollinger Bands:In the event of a decline, the lower boundary of the indicator near 1.2681 will act as support.
Indicator Descriptions:
- Moving Average: Smooths volatility and noise to indicate the current trend.
- Period 50: Yellow on the chart.
- Period 30: Green on the chart.
- MACD (Moving Average Convergence/Divergence):
- Fast EMA: 12.
- Slow EMA: 26.
- SMA: 9.
- Bollinger Bands:
- Period: 20.
- Non-Commercial Traders: Speculative participants such as individual traders, hedge funds, and large institutions using the futures market for speculative purposes.
- Long Non-Commercial Positions: Total long open positions held by non-commercial traders.
- Short Non-Commercial Positions: Total short open positions held by non-commercial traders.
- Net Non-Commercial Position: The difference between long and short positions of non-commercial traders.
 English
 Русский
 Bahasa Indonesia
 Bahasa Malay
 ไทย
ไทย Español
 Deutsch
 Български
 Français
 Tiếng Việt
 中文
中文 বাংলা
বাংলা हिन्दी
 Čeština
 Українська
 Română

