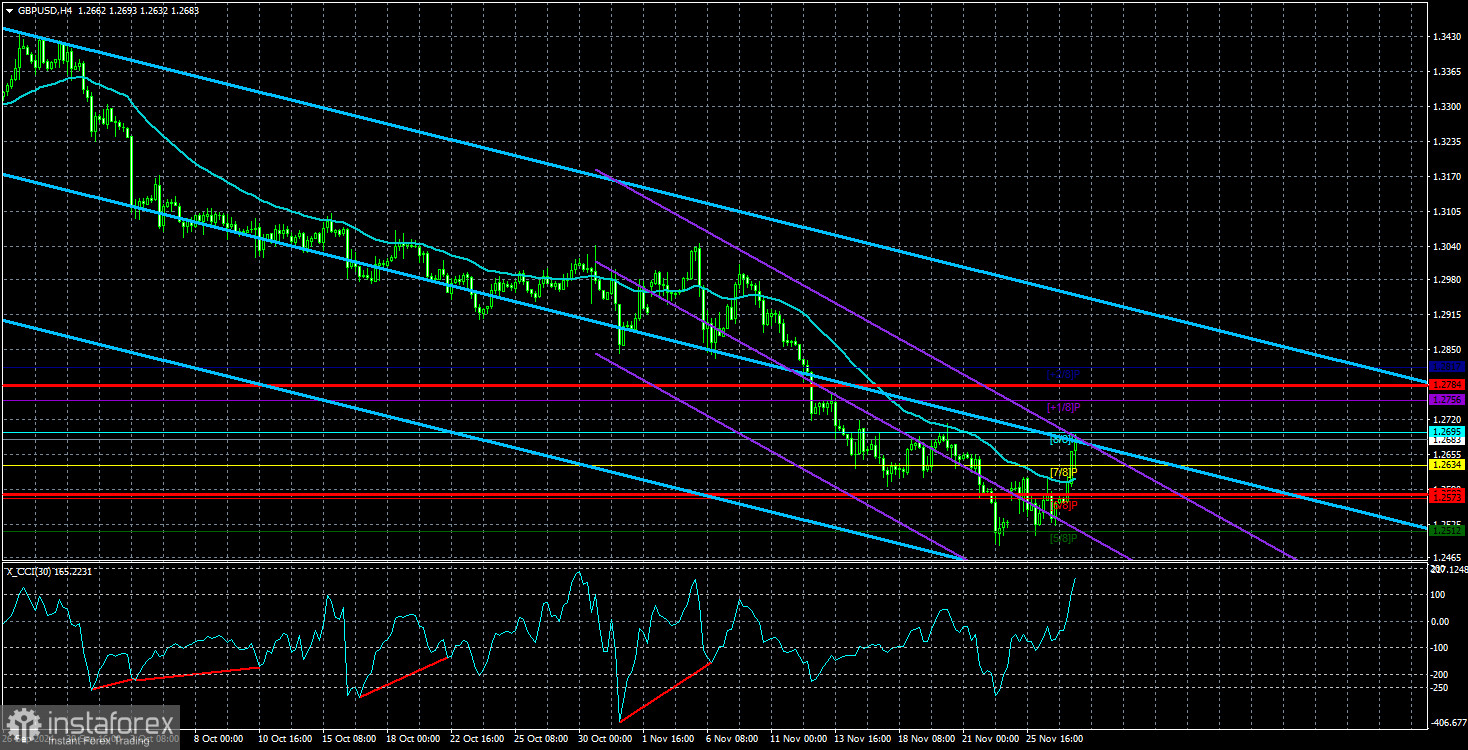
On Wednesday, the GBP/USD currency pair closed above the moving average line, paving the way for a potential correction. The GBP/USD pair's break above the moving average line on Wednesday suggests the possibility of a stronger correction. However, corrections are inherently unpredictable. They can vary significantly in size and duration, with prices remaining flat or exhibiting minimal movement for extended periods. Whether to engage in trading during such corrections is a decision each trader must make individually. We recommend trading in line with the prevailing trend, as highlighted in technical analysis principles.
Wednesday's rise in the pound was partly driven by weaker-than-expected U.S. economic data. However, while some reports underperformed forecasts, they did not indicate a major downturn. Therefore, there is no reason for alarm. The pound, like the euro, has been oversold, with the CCI indicator frequently entering extreme zones and forming multiple divergences. However, this does not suggest a substantial rally of 200–500 points. As long as the price remains above the moving average, long positions are possible, but traders should exercise caution, as the correction could be short-lived.
On the weekly timeframe, the pound has the potential to decline to the 1.18 level. While the two-year uptrend could resume, there are currently no strong fundamental reasons to support a long-term rally for the pound. Is the British economy outperforming the U.S. economy? No. Does the Bank of England have less room to cut rates than the Federal Reserve? No. Are there no significant issues in the U.K.? Again, no. Is a U.S. economic crisis imminent? No. Thus, we see no justification for long-term strength in the pound.
Market makers may artificially push the pound higher, as seen previously. Such movements lack logical justification and are difficult to forecast. For now, we anticipate a minor correction followed by a renewed downward trend. If the pound rises unexpectedly and without clear reasons, traders must decide whether to capitalize on the movement using technical trading strategies or to avoid it altogether.

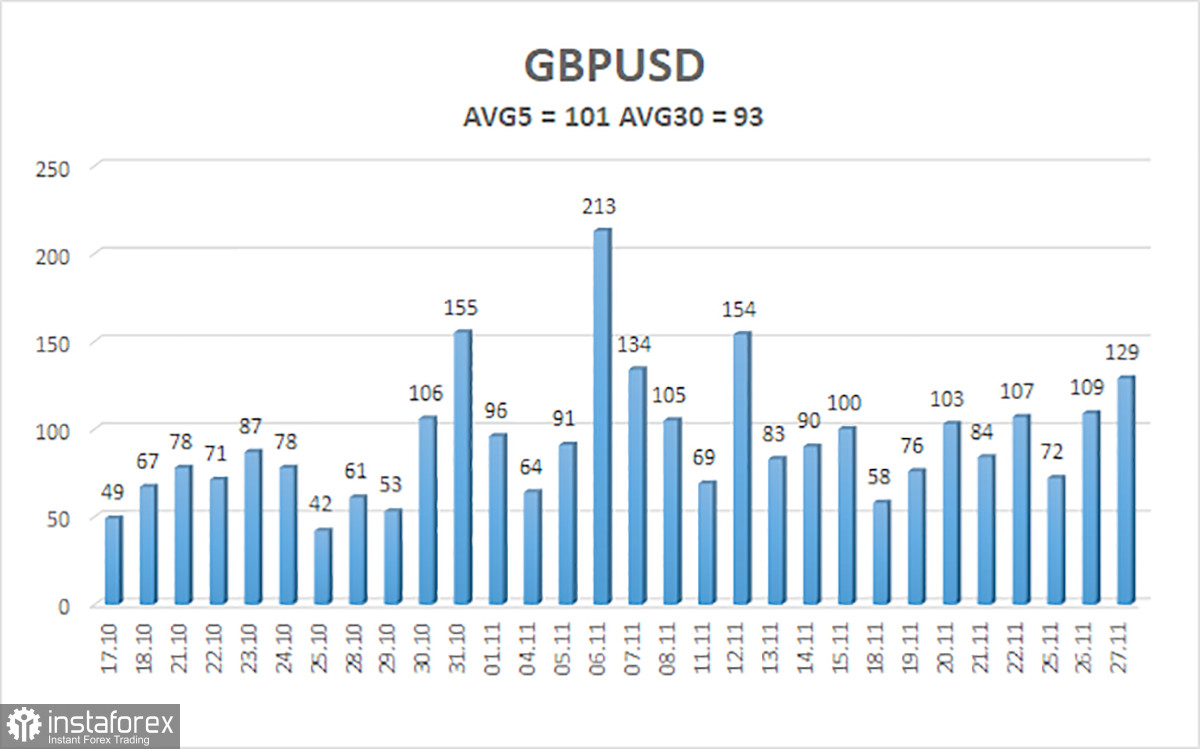
The average volatility of the GBP/USD pair over the last five trading days is 101 points, which is considered moderate for the pair. On Thursday, November 28, we expect the pair to trade within the range of 1.2582 to 1.2784. The senior linear regression channel points downward, indicating a persistent bearish trend. The CCI indicator has formed several bullish divergences and entered the oversold zone multiple times. While a correction has begun, its strength remains uncertain.
Support Levels:
- S1 – 1.2634
- S2 – 1.2573
- S3 – 1.2512
Resistance Levels:
- R1 – 1.2695
- R2 – 1.2756
- R3 – 1.2817
Trading Recommendations:
The GBP/USD pair continues to follow a bearish trend. We remain cautious about long positions, as the market appears to have fully priced in all potential bullish catalysts for the pound.
- Long positions can be considered if the price remains above the moving average, with targets at 1.2756 and 1.2784, based on technical analysis.
- Short positions are more relevant, targeting 1.2512 and 1.2451, if the price closes below the moving average again.
Explanation of Illustrations:
- Linear regression channels identify the current trend. When both channels align in one direction, the trend is strong.
- The moving average line (settings 20,0, smoothed) determines short-term trends and trading direction.
- Murray levels indicate target levels for price movements and corrections.
- Volatility levels (red lines) show the probable price range for the next 24 hours based on current metrics.
- The CCI indicator entering oversold (below -250) or overbought (above +250) zones signals a potential trend reversal.
 English
 Русский
 Bahasa Indonesia
 Bahasa Malay
 ไทย
ไทย Español
 Deutsch
 Български
 Français
 Tiếng Việt
 中文
中文 বাংলা
বাংলা हिन्दी
 Čeština
 Українська
 Română

