EUR/USD 5-Minute Analysis

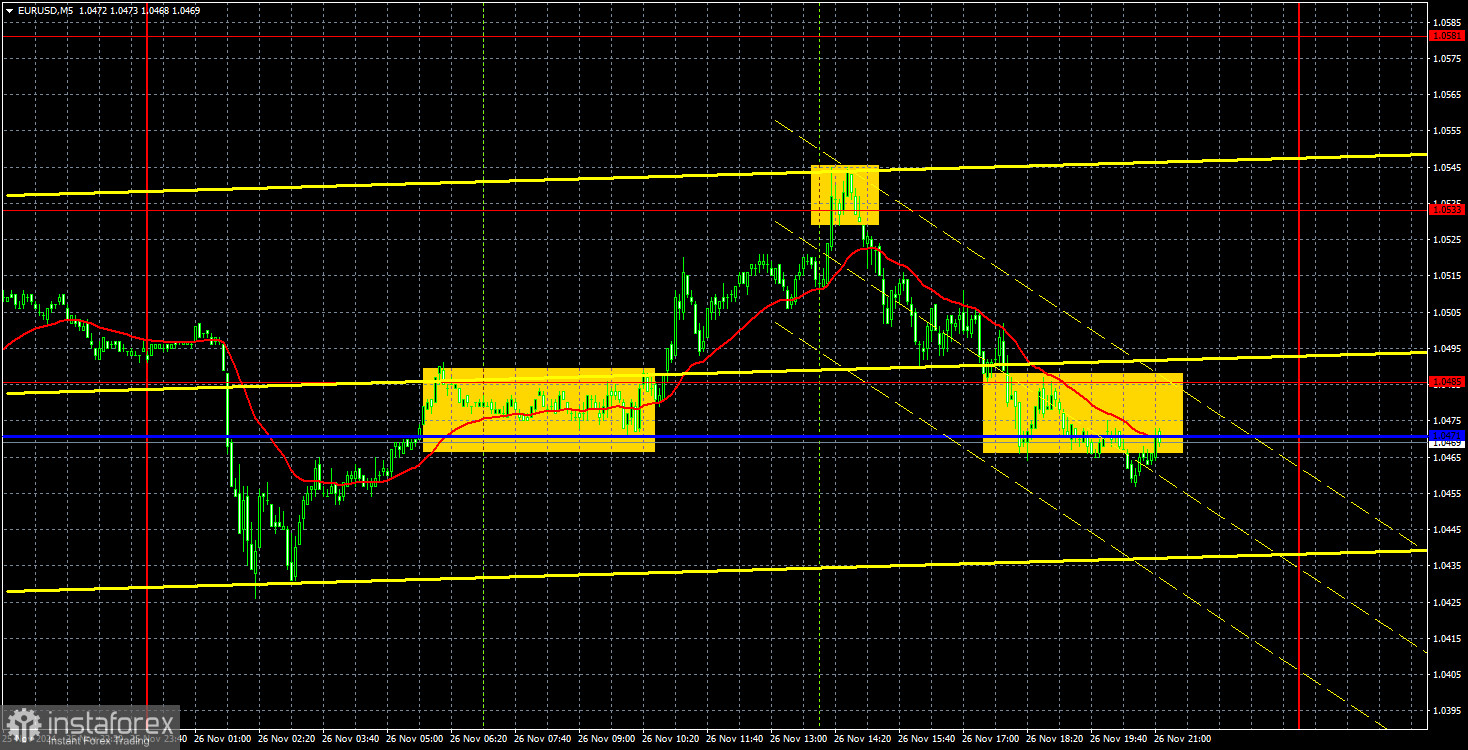
On Tuesday, the EUR/USD pair attempted another correction and even broke through the trendline. However, the upward movement ended as quickly as it began. Essentially, we continue to observe weak attempts by the bulls to lift the pair from multi-month lows. Although the price has settled above the critical line, the current technical picture does not resemble the start of an upward trend or even a strong upward correction. Furthermore, the fundamental and macroeconomic backdrop this week is weak. In the first two days of the week, traders have had no significant or impactful news events to act on.
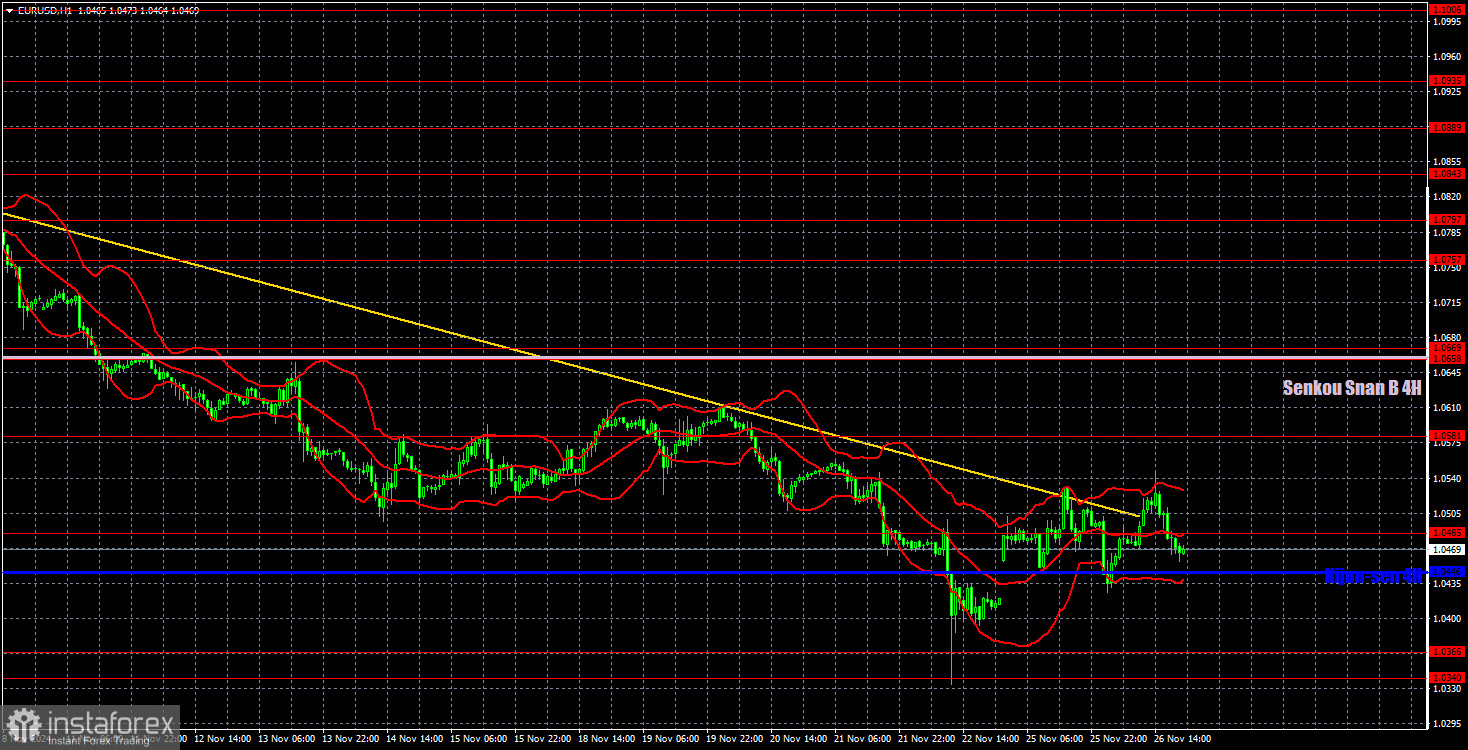
The euro has long lacked inspiration and support, which hasn't improved. As a result, we still believe that the euro's decline should continue in the medium term. A resumption of the downtrend can be confirmed if the price moves back below the Kijun-sen line.
This week, the euro can only count on Friday's report on European inflation and possibly the German inflation report. However, it's worth noting that these reports might not favor the euro either.
Trading signals on Tuesday were quite strong. The price first bounced off the 1.0471–1.0485 area and rose to the 1.0533 level. It then reversed from the 1.0533 level and returned to the 1.0471–1.0485 area. If the price breaks below this area, it will justify remaining in short positions targeting 1.0366. Overall, the outlook for the euro remains grim.
COT Report

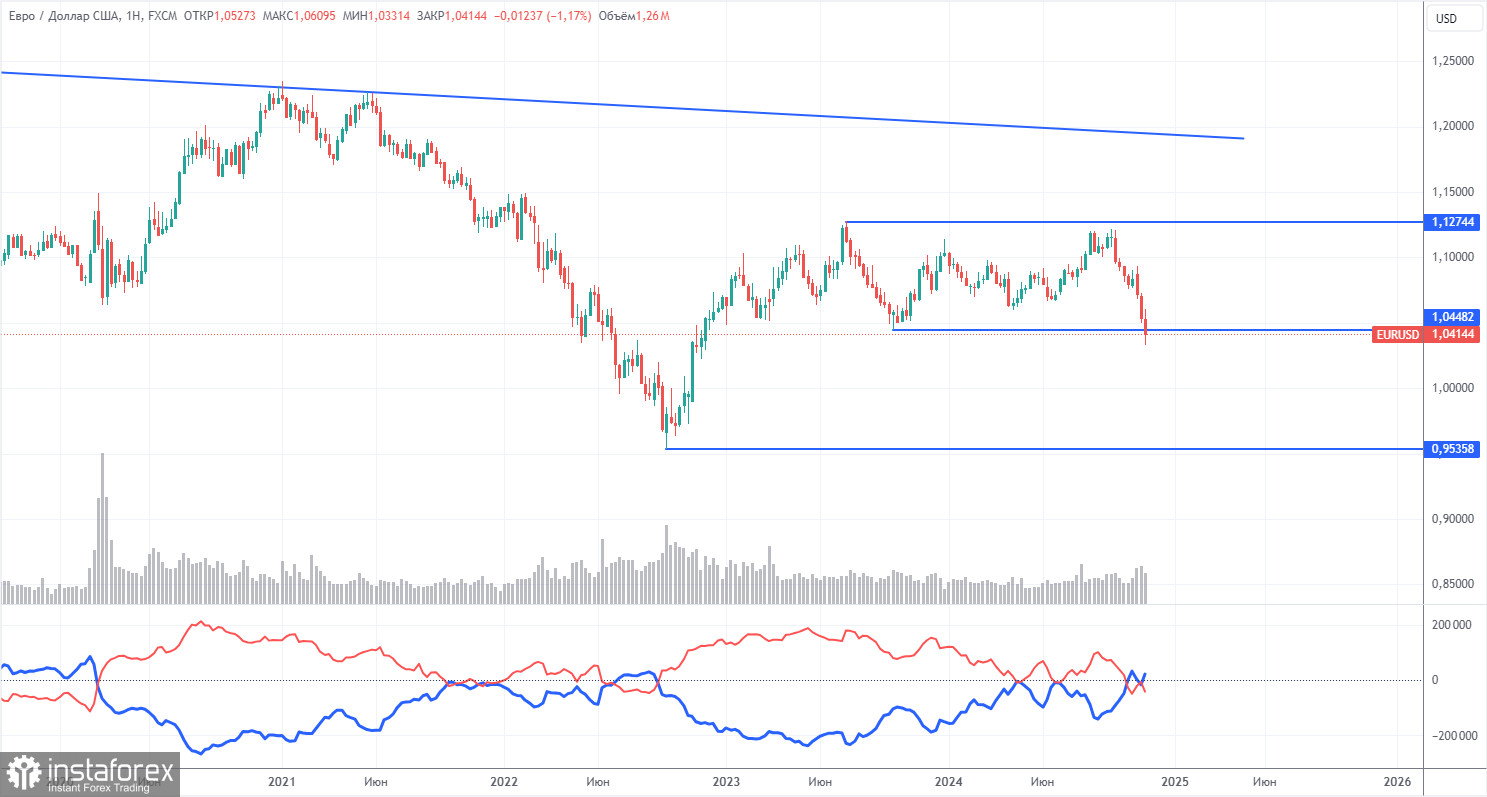
The latest COT (Commitment of Traders) report, dated November 19, shows that non-commercial traders' net position has been bullish for a long time, though bears are gradually gaining dominance. A month ago, the number of short positions held by professional traders surged, flipping the net position negative for the first time. This indicates that the euro is now being sold more frequently than bought.
We still see no fundamental factors supporting the euro's strength, and technical analysis suggests the pair is stuck in a consolidation phase—or, simply put, a flat trend. The weekly timeframe shows that the pair has been trading between 1.0448 and 1.1274 since December 2022. This makes further declines even more likely, and a break below 1.0448 would open the door for more significant losses.
Currently, the red and blue lines in the COT chart have crossed, reversing their positions relative to one another. During the last reporting week, the number of long positions in the non-commercial group decreased by 5,700, while short positions increased by 29,400. As a result, the net position fell by an additional 35,100 contracts.
EUR/USD 1-Hour Analysis

On the hourly timeframe, the pair continues to form a downtrend. There's no point in discussing fundamental or macroeconomic reasons for a medium-term decline in the dollar—it still lacks such factors. In the medium term, we expect nothing but further declines. Day by day, it becomes more apparent that the market has fully priced in the Federal Reserve's monetary policy easing cycle, and now the Fed is in no hurry to cut rates further, as previously anticipated. The euro can only rely on a correction, but even a minor upward correction is proving difficult.
On November 27, we highlight the following levels for trading - 1.0269, 1.0340-1.0366, 1.0485, 1.0581, 1.0658-1.0669, 1.0757, 1.0797, 1.0843, 1.0889, 1.0935, as well as the Senkou Span B (1.0658) and Kijun-sen (1.0446) lines. Remember that the Ichimoku indicator lines may shift throughout the day, so factor that into trading signals. Don't forget to place a Stop Loss at breakeven if the price moves 15 pips in your favor. This will protect against potential losses if the signal turns out to be false.
No notable events are scheduled in the Eurozone, but the U.S. will see a slew of reports, including GDP data, durable goods orders, the PCE index, and unemployment claims. While the list is extensive, only the PCE index and durable goods orders will likely significantly influence the dollar's exchange rate.
Illustration Explanations:
- Support and Resistance Levels (thick red lines): Key areas where price movement might stall. Not sources of trading signals.
- Kijun-sen and Senkou Span B Lines: Ichimoku indicator lines transferred from the H4 timeframe to the hourly chart, serving as strong levels.
- Extreme Levels (thin red lines): Points where the price has previously rebounded. They can serve as trading signal sources.
- Yellow Lines: Trendlines, channels, or other technical patterns.
- Indicator 1 on COT Charts: Reflects the net position size of each trader category.
 English
 Русский
 Bahasa Indonesia
 Bahasa Malay
 ไทย
ไทย Español
 Deutsch
 Български
 Français
 Tiếng Việt
 中文
中文 বাংলা
বাংলা हिन्दी
 Čeština
 Українська
 Română

