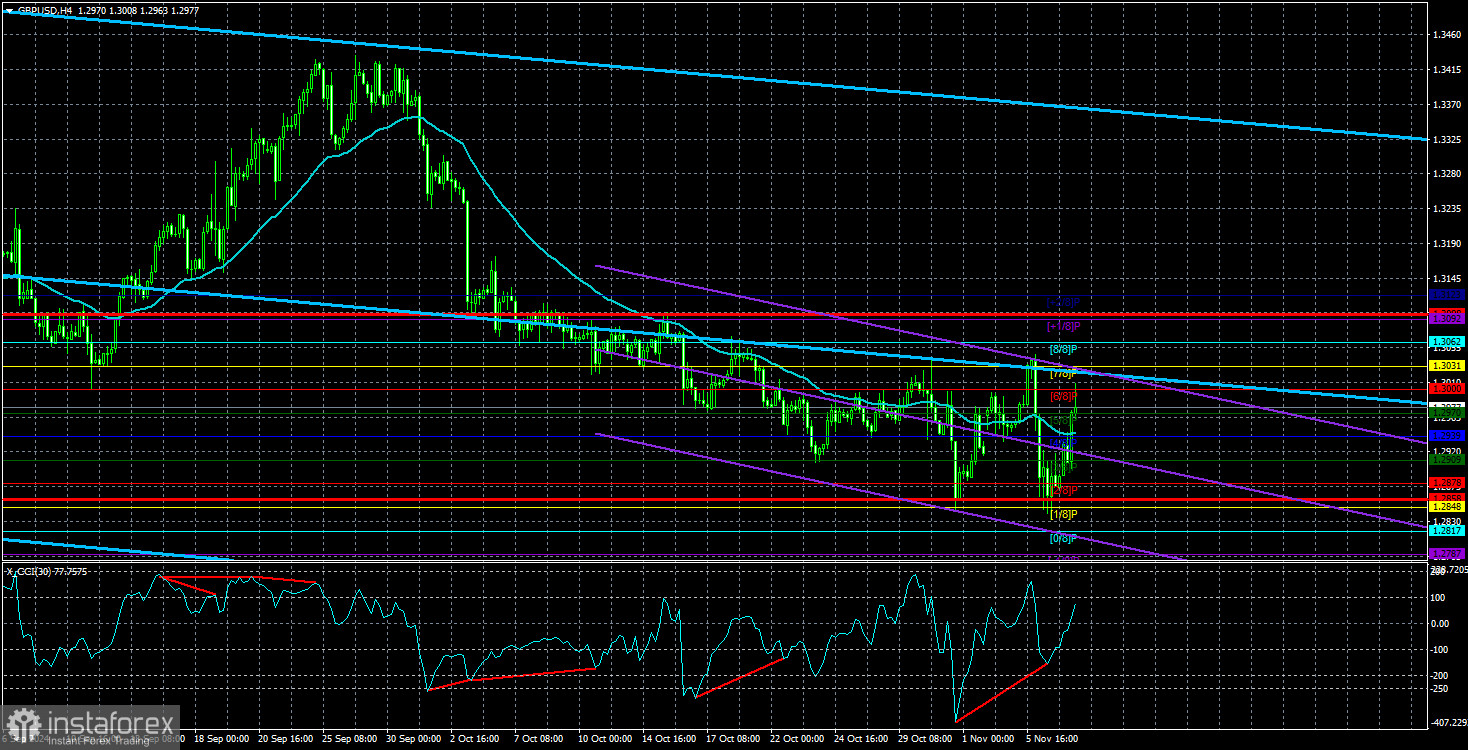
The GBP/USD pair rose on Thursday after the Bank of England lowered its key interest rate. Why did this happen, and why is it unsurprising? Earlier this week, we warned that a flood of significant fundamental events could cause volatile price swings in both directions. On Wednesday, the pair dropped nearly 250 pips—an event that happens once every few months at best. By Thursday, the pound was locally oversold, and the Bank of England's rate cut decision had been anticipated for weeks. Therefore, instead of seeing the pound fall, it rose. Movements following the Fed meeting are not being analyzed yet, as time is needed for the market to stabilize and fully digest the results.
Movements throughout this week should not form the basis of long-term strategies or analyses. The market has been trading emotionally, creating erratic price actions. Traders should wait for the market to calm down and return to normalcy. Once it stabilizes, the overall technical picture will likely remain unchanged. In the next week or two, we expect an upward correction, but in the medium term, we anticipate the pound will resume its decline.
The BoE's decision was slightly more dovish than anticipated. Eight out of nine Monetary Policy Committee members voted to lower the rate by 0.25%, whereas forecasts had predicted seven votes in favor. Thus, the MPC was slightly more dovish than expected. However, in essence, this does not affect anything. We believe the BoE will lower rates at every upcoming meeting, providing further downside pressure for the pound. The BoE's accompanying statement indicated readiness to continue monetary easing if economic indicators align with expectations.
The only potential obstacle to consistent rate cuts by the BoE is inflation. While the Consumer Price Index has slowed to 1.7%, the BoE forecasts a rise to 2.5% due to a low base effect linked to energy prices. Inflation in the European Union has also been growing in recent months. If inflation doesn't exceed 2.5% and slows, the BoE will likely avoid taking prolonged pauses in its easing cycle. After a correction, the pound is expected to resume its downward trajectory.
From a technical point of view, the price has consolidated below the Ichimoku cloud in the daily time frame and remains under the Kijun-sen line, providing no grounds for resuming the two-year uptrend. Due to extreme volatility, the pair crossed the moving average line multiple times this week in the 4-hour time frame. Such signals should not be taken seriously, as directional trends have been inconsistent.

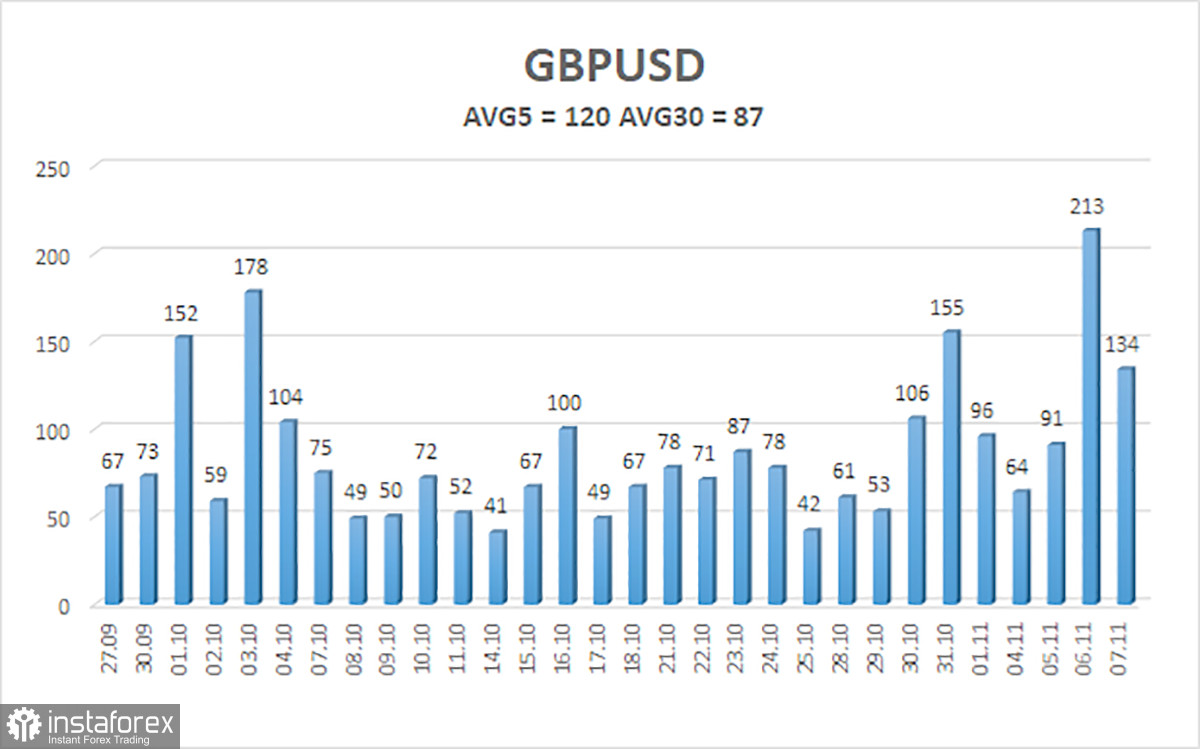
The average volatility of the GBP/USD pair over the last five trading days is 120 pips, which is "high" for the pair. On Friday, November 8, we expect movement inside the range bounded by the levels of 1.2858 and 1.3098. The higher linear regression channel has turned downward, which signals a downtrend. The CCI indicator formed a bullish divergence—a new upward correction has started.
Nearest Support Levels:
- S1: 1.2970
- S2: 1.2939
- S3: 1.2909
Nearest Resistance Levels:
- R1: 1.3000
- R2: 1.3031
- R3: 1.3062
Trading Recommendations:
The GBP/USD pair maintains a downward trend. Long positions remain unappealing as we believe the pound's growth factors have already been priced multiple times. For those trading "pure technicals," long positions are possible with targets at 1.3062 and 1.3092, provided the price moves above the moving average line. Short positions remain more relevant, targeting 1.2878 and 1.2848, provided the price remains below the moving average. This week's erratic movements are driven by strong fundamental events, creating volatility and mixed directional trends.
Explanation of Illustrations:
Linear Regression Channels help determine the current trend. If both channels are aligned, it indicates a strong trend.
Moving Average Line (settings: 20,0, smoothed) defines the short-term trend and guides the trading direction.
Murray Levels act as target levels for movements and corrections.
Volatility Levels (red lines) represent the likely price range for the pair over the next 24 hours based on current volatility readings.
CCI Indicator: If it enters the oversold region (below -250) or overbought region (above +250), it signals an impending trend reversal in the opposite direction.
 English
 Русский
 Bahasa Indonesia
 Bahasa Malay
 ไทย
ไทย Español
 Deutsch
 Български
 Français
 Tiếng Việt
 中文
中文 বাংলা
বাংলা हिन्दी
 Čeština
 Українська
 Română

