The GBP/USD currency pair started to rise but quickly dropped as the U.S. ADP report—considered a precursor to Non-Farm Payrolls—was released. It's worth noting, however, that there is no consistent correlation between ADP and Non-Farm Payrolls. The ADP report might come in twice as strong as forecast, while Non-Farm Payrolls could be twice as weak, and the job creation figures often don't align. Ultimately, the non-farm data will shape the market and the Federal Reserve's perspectives on the labor market. Therefore, while the dollar received a boost yesterday, the actual tests lie ahead.
The British pound, meanwhile, took the opportunity to weaken further, which is reasonable. Unlike the euro, supported by positive GDP data, the pound had no such backstop. Once the U.S. reports were out, the market quickly resumed buying the dollar. The GBP/USD pair is currently holding near its local low, but if the upcoming U.S. data is strong, further declines in the pound could be imminent.
We believe that this downtrend will ultimately continue. The pound, like the euro, remains overbought and unjustifiably expensive. The Bank of England's prolonged hawkish stance is now weighing on the pound. The logic is simple: the longer the BoE delays easing, the faster and more aggressively it will likely need to cut rates in the future, which may be imminent. While the U.S. easing cycle is primarily factored into the market, the UK has yet to begin this process. Therefore, we believe the pound has substantial room to fall, with significant downside potential.
The state of the British economy, which has been struggling for at least the past two years, deserves particular attention. The downturn traces back to 2016 when the UK narrowly voted to leave the European Union. The British pound has been in a downtrend for 16 years. At present, we see no compelling reason to consider this trend complete.
We still anticipate a technical correction in the short term, but the market will likely respond to macroeconomic factors rather than technical ones for the rest of the week. Movements will thus depend on U.S. data. Once these reports are fully released, the market will predict the Fed's next steps in its meeting scheduled for next week. If rates are cut by 0.25%, it's unlikely to put significant pressure on the dollar. The U.S. currency could only come under pressure if the Fed begins to accelerate easing, which would require strong justification.

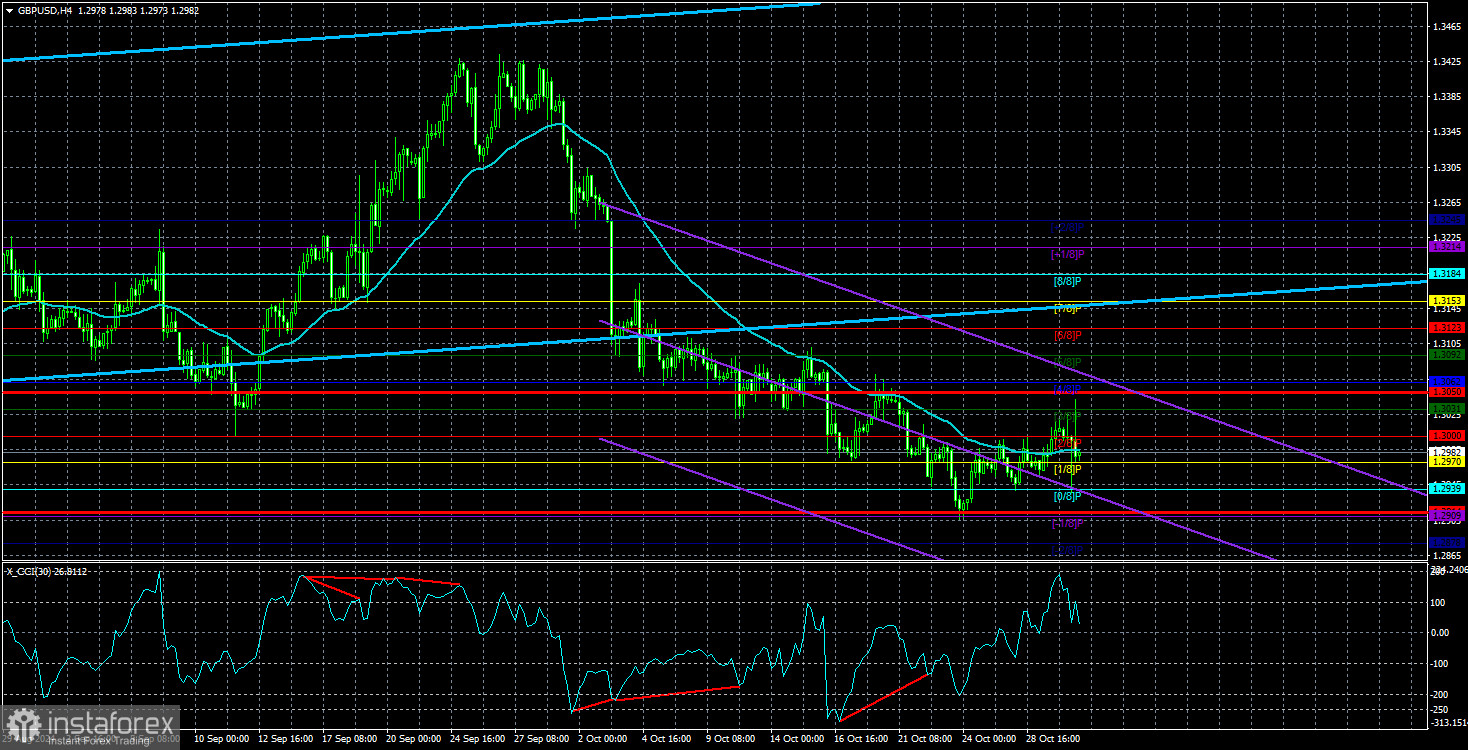
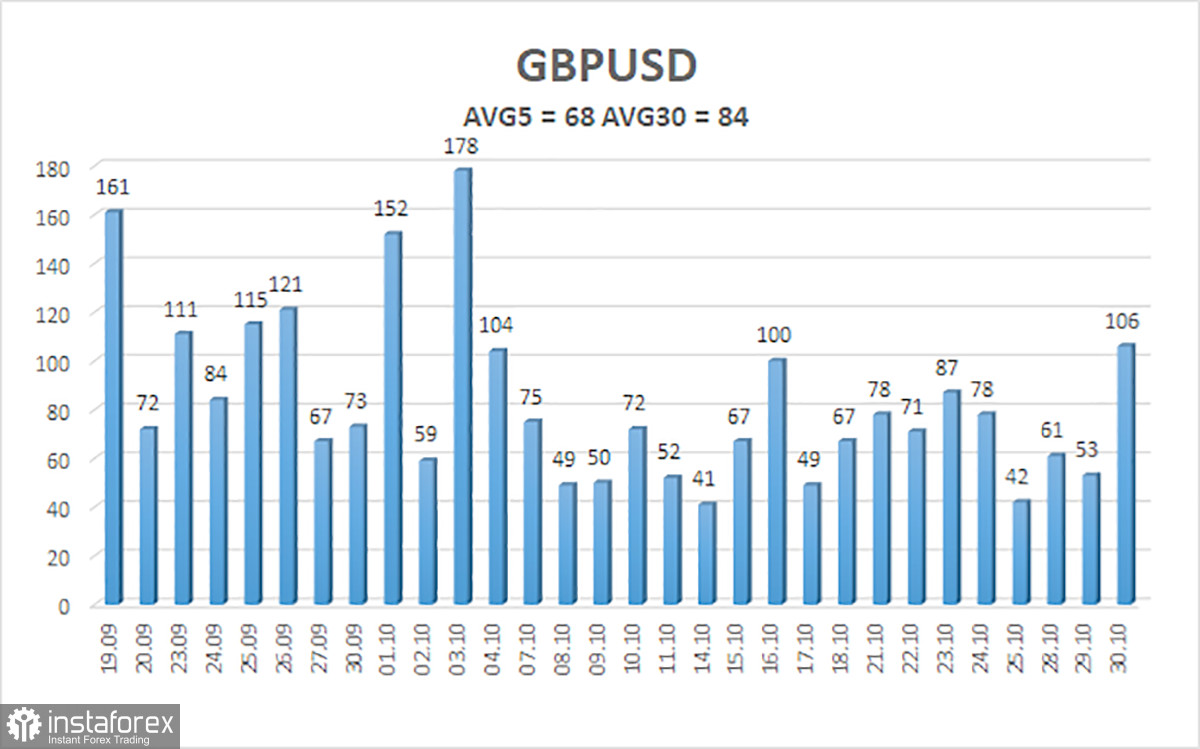
The average volatility over the past five trading days was 68 pips, considered "moderate" for the pair. Thus, on Thursday, October 31, we expect movement within the 1.2914 to 1.3050 range. The higher linear regression channel is tilted upward, indicating a continued uptrend. The CCI indicator has entered oversold territory and formed several bullish divergences, suggesting a potential upward correction.
Nearest Support Levels:
- S1 – 1.2970
- S2 – 1.2939
- S3 – 1.2909
Nearest Resistance Levels:
- R1 – 1.3000
- R2 – 1.3031
- R3 – 1.3062
Trading Recommendations:
The GBP/USD pair remains in a downtrend. We still do not consider long positions as we believe the factors supporting the pound have already been largely priced in. Long positions are feasible if trading purely on technicals, with targets at 1.3062 and 1.3092 if the price moves above the moving average. However, short positions are currently more relevant, with targets at 1.2909 and 1.2878, but will require confirmation with a move below the moving average. Due to a strong macroeconomic backdrop, mixed movements may occur toward the end of the trading week.
Explanation of Illustrations:
Linear Regression Channels help determine the current trend. If both channels are aligned, it indicates a strong trend.
Moving Average Line (settings: 20,0, smoothed) defines the short-term trend and current trading direction.
Murray Levels act as target levels for movements and corrections.
Volatility Levels (red lines) represent the likely price range for the pair over the next 24 hours based on current volatility readings.
CCI Indicator: If it enters the oversold region (below -250) or overbought region (above +250), it signals an impending trend reversal in the opposite direction.
 English
 Русский
 Bahasa Indonesia
 Bahasa Malay
 ไทย
ไทย Español
 Deutsch
 Български
 Français
 Tiếng Việt
 中文
中文 বাংলা
বাংলা हिन्दी
 Čeština
 Українська
 Română

