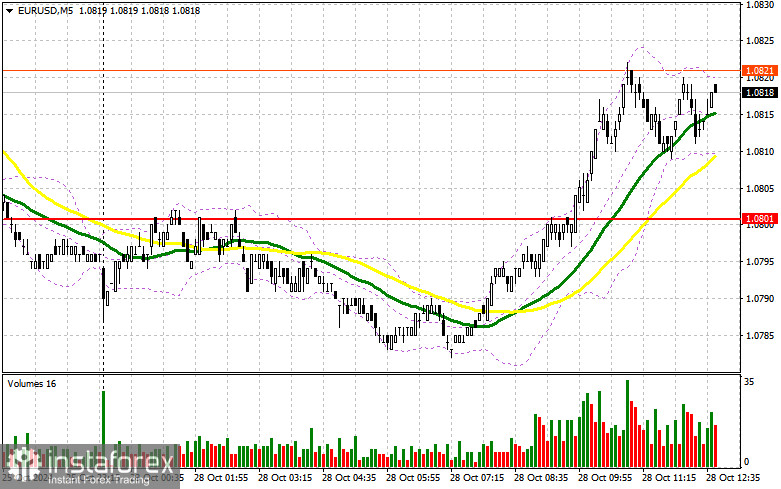
In my morning forecast, I highlighted the level of 1.0801 and planned to make market entry decisions based on it. Let's look at the 5-minute chart and see what happened. The upward movement and false breakout at this level provided an excellent entry point for selling, but the expected downward movement didn't materialize, resulting in taking losses. The technical outlook was unchanged for the second half of the day.

To Open Long Positions on EUR/USD:
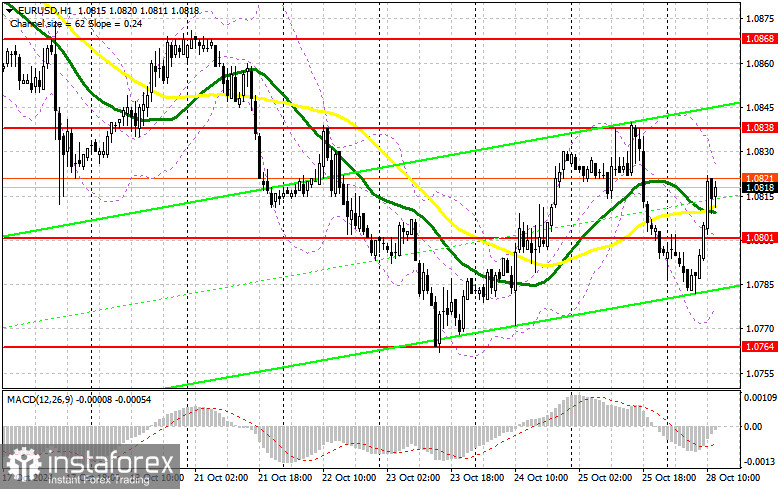
With a lack of Eurozone data, buyers seemed to take advantage of thin market conditions, pushing above 1.0801 with minimal resistance. Their primary task in the second half of the day will be to defend this level. A false breakout at this level amidst the absence of significant U.S. data would create favorable conditions for building long positions, opening the way back to 1.0838. A breakout and retest of this range will confirm a buying point with a target of reaching 1.0868. The final target is 1.0900, where I plan to take profits. If EUR/USD declines and no activity is seen around 1.0801 in the second half of the day—where moving averages favor the sellers—the pair will likely revert to support at 1.0764, creating significant challenges for buyers. I'll only enter here after a false breakout form. I plan to open long positions on a rebound from 1.0738, targeting a short-term upward correction of 30-35 points.
To Open Short Positions on EUR/USD:
Sellers made no attempts in the first half of the day, which was surprising, especially after their active behavior on Friday. Now, bears have a much more critical task: defending the upper boundary of the consolidation range at 1.0838. If the pair rises, a false breakout at this level will provide an entry point for short positions with the potential to move down to support at 1.0801, which is reinforced by moving averages that favor the bulls. A break and hold below this range, followed by a retest from below, will serve as another valid selling point, with movement toward 1.0764, erasing buyers' growth prospects. The final target is the 1.0738 level, where I'll take profits. If EUR/USD rises in the second half of the day and bears are absent at 1.0838, buyers will have a chance to build a larger upward correction. In this case, I'll delay sales until testing the next resistance at 1.0868. I'll also sell here, but only after an unsuccessful consolidation. I plan to open short positions immediately on a rebound from 1.0900, targeting an intraday downward correction of 30-35 points.

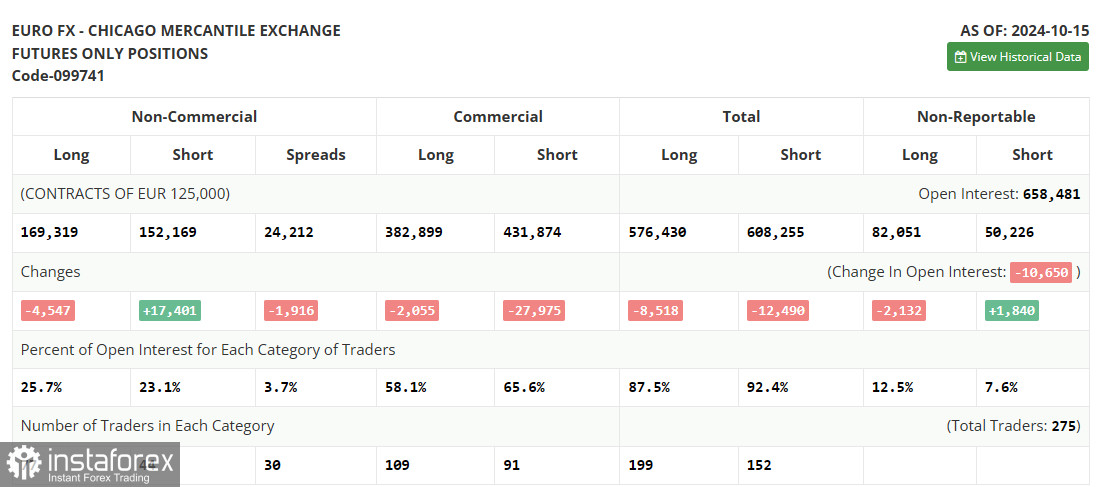
The October 15 COT report showed a sharp increase in short positions and a further reduction in long positions. The data clearly reflects the recent decision by the European Central Bank to cut rates, and the focus on a more aggressive policy easing by year's end has visibly shifted market dynamics. Now, risk asset buyers no longer dominate as before, with the balance nearly equal: 169,319 versus 152,169. This week promises to be relatively quiet, as little important data is expected, so the euro's bearish market remains the focal point. The COT report indicates that long non-commercial positions decreased by 4,547 to 169,319, while short non-commercial positions increased by 17,401 to 152,169, narrowing the net gap between long positions and short positions by 1,402.

Indicator Signals:
Moving Averages
Trading occurs slightly above the 30 and 50-day moving averages, indicating a pair correction.
Note: The period and moving average prices are considered on the hourly H1 chart and differ from the conventional moving averages on the D1 daily chart.
Bollinger Bands
In case of a decline, the lower boundary of the indicator at around 1.0785 will act as support.
Indicator Descriptions:
- Moving Average: Determines the current trend by smoothing volatility and noise. Period – 50 (yellow on the chart); period – 30 (green on the chart).
- MACD Indicator (Moving Average Convergence/Divergence): Fast EMA – period 12; Slow EMA – period 26; SMA – period 9.
- Bollinger Bands: Period – 20.
- Non-commercial traders: Speculators like individual traders, hedge funds, and large institutions who use the futures market for speculative purposes and meet specific requirements.
- Long non-commercial positions represent the total open long positions of non-commercial traders.
- Short non-commercial positions represent the total open short positions of non-commercial traders.
- Total non-commercial net position is the difference between short and long positions of non-commercial traders.
 English
 Русский
 Bahasa Indonesia
 Bahasa Malay
 ไทย
ไทย Español
 Deutsch
 Български
 Français
 Tiếng Việt
 中文
中文 বাংলা
বাংলা हिन्दी
 Čeština
 Українська
 Română

