Friday's Trade Analysis:
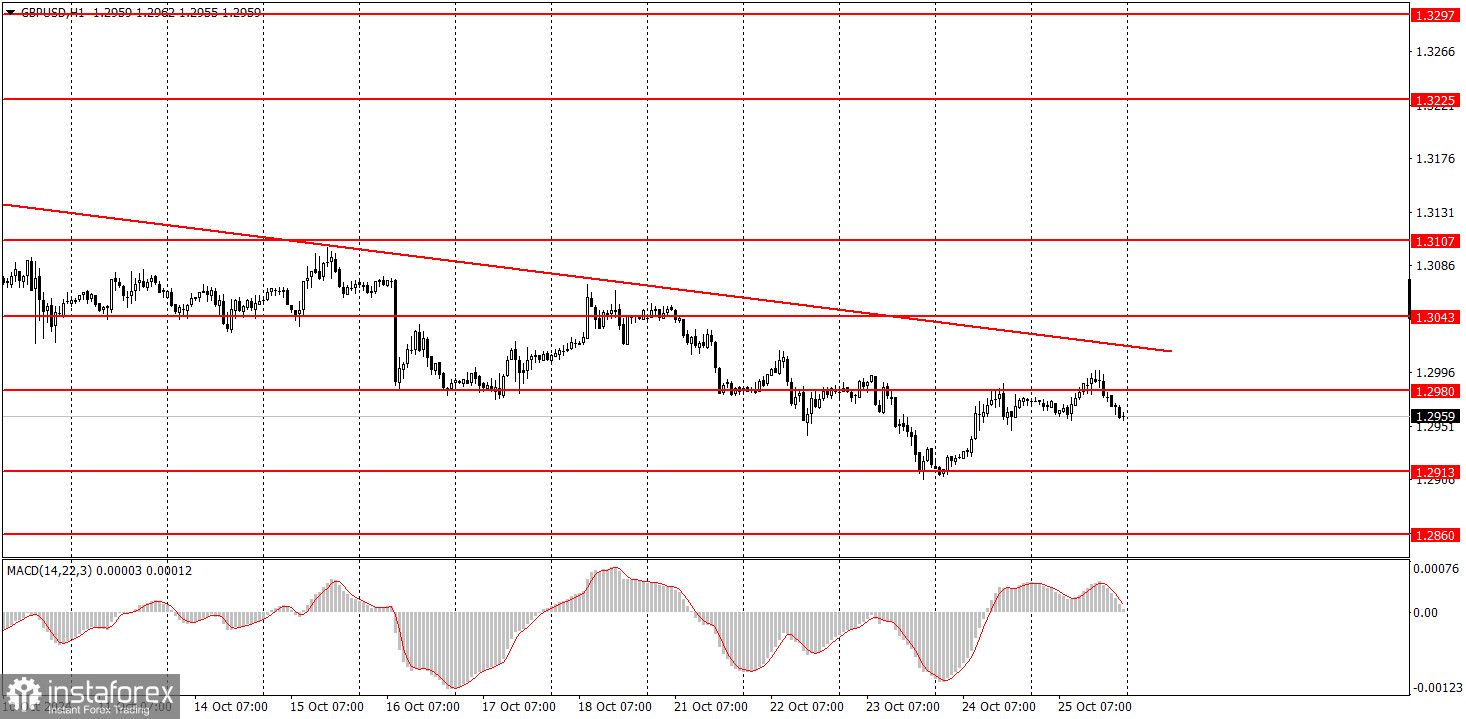
1H Chart of GBP/USD Pair

On Friday, the GBP/USD pair traded lower, although it barely declined by the end of the day. However, Friday's movements hold little significance for the pound. Firstly, the price remains below the trendline, so there is no reason to assume that an upward correction has started. Secondly, in the medium term, we expect only declines in the British currency. Lastly, the pound had no macroeconomic support to rally this week. The only reports from the UK were on business activity, which came in weaker than forecast. Moreover, the Bank of England's prospects of a quick rate cut add no optimism for pound buyers.
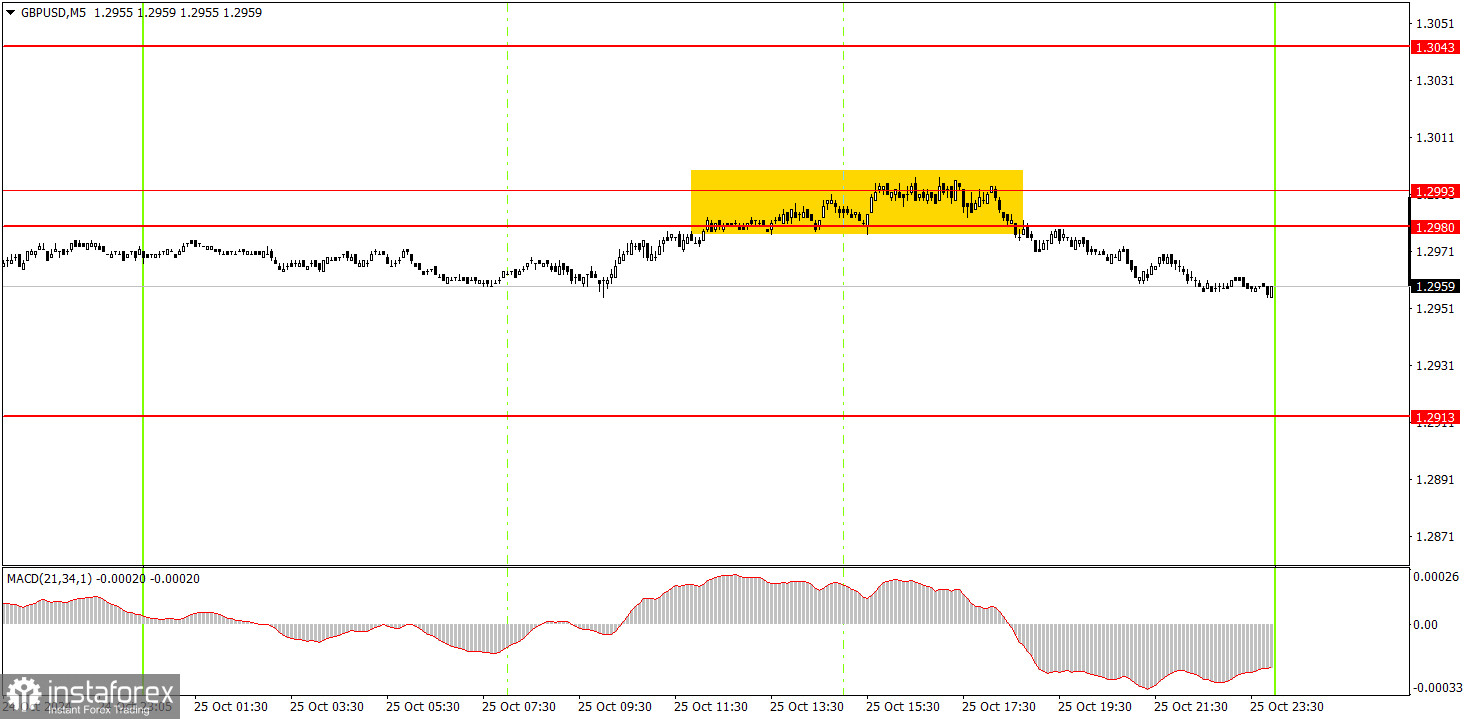
5M Chart of GBP/USD Pair

In the 5-minute time frame, there was only one trading signal on Friday. During the U.S. session, the price rebounded from the 1.2980-1.2993. Was it worth acting on this signal so close to the market close? That's up to the trader's discretion. A Stop Loss could have been set to breakeven before the market closed, allowing for a calm weekend.
How to Trade on Monday:
In the hourly time frame, the GBP/USD pair has broken the uptrend and continues to decline. In the medium term, we fully support the pound's decline, as this seems to be the most likely scenario. The pound might attempt a correction soon but must break above the trendline to confirm this. Currently, the pound has no grounds for growth, so expecting a solid upward move is unlikely.
The pair may resume its downtrend on Monday, as the trendline has not been broken. Until the price surpasses the trendline, buying is not advisable. And even in that case, it would only indicate a correction.
In the 5-minute time frame, trading can be conducted around the levels 1.2848-1.2860, 1.2913, 1.2980-1.2993, 1.3043, 1.3102-1.3107, 1.3145-1.3167, 1.3225, 1.3272, 1.3365, and 1.3428-1.3440. No significant events are scheduled for Monday in the UK or the U.S., so we're likely in for low volatility and sluggish movements.
Basic Trading System Rules:
- The strength of a signal is determined by the time it takes to form (whether a bounce or breakthrough of a level). The quicker the formation, the stronger the signal.
- If two or more trades have been made near a level due to false signals, any further signals from that level should be ignored.
- In a flat market, a pair can generate many false signals or none at all. In any case, it's best to stop trading at the first signs of a flat market.
- Trading occurs between the start of the European and middle of the US sessions, after which all trades should be manually closed.
- On the hourly time frame, it's recommended to trade MACD indicator signals only when there is good volatility and a trendline or trend channel confirms a trend.
- If two levels are too close together (5 to 20 pips apart), they should be treated as support or resistance areas.
- After the price moves 20 pips in the intended direction, set the Stop Loss to breakeven.
What's on the Charts:
Support and Resistance Levels: Levels that serve as targets for opening buys or sells. Take Profit levels can be placed around these areas.
Red Lines: Channels or trend lines that indicate the current trend and the preferred trading direction.
MACD Indicator (14,22,3): Histogram and signal line—an auxiliary indicator that can also be used as a source of signals.
Major speeches and reports (always found in the news calendar) can significantly impact currency pair movements. Therefore, it's advised to trade cautiously or exit the market during their release to avoid sharp price reversals against prior movements.
Beginners trading on the forex market should remember that not every trade will be profitable. A clear strategy and money management are the keys to success in long-term trading.
 English
 Русский
 Bahasa Indonesia
 Bahasa Malay
 ไทย
ไทย Español
 Deutsch
 Български
 Français
 Tiếng Việt
 中文
中文 বাংলা
বাংলা हिन्दी
 Čeština
 Українська
 Română

