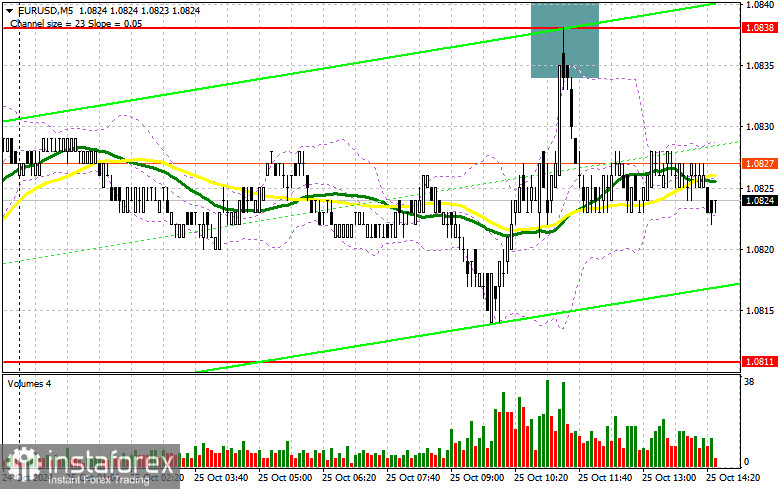
In my morning forecast, I emphasized the 1.0838 level and planned to make entry decisions based on it. Let's look at the 5-minute chart and analyze what happened there. The rise and formation of a false breakout at that level offered a favorable entry point for selling, leading to a subsequent 15-point drop, accounting for most of the day's intraday volatility. The technical outlook was not adjusted for the latter half of the day.

To Open Long Positions on EUR/USD:
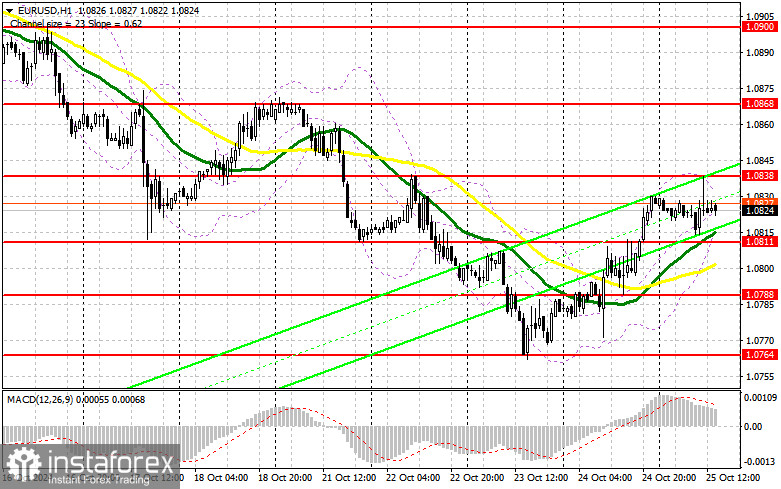
The evident reaction to data from Germany, followed by a complete lack of initiative, has kept trading within a sideways channel for the second half of the day. Upcoming data includes U.S. durable goods orders, as well as the University of Michigan's consumer sentiment index and inflation expectations. If these releases align with economists' forecasts, euro buyers might attempt to break above 1.0838 again. If the pair declines after the data, actions will follow the morning plan, but only around the 1.0811 support area. A false breakout formation there would create a suitable condition for building up long positions, opening the way back to the 1.0838 level. A breakout and subsequent retest of this range could provide a potential entry point for buying, with a target of reaching 1.0868. The upper target would be the 1.0900 high, where I plan to take profits. If EUR/USD declines and there is a lack of buying interest around 1.0811 in the second half of the day, trading will remain within the channel, and the pair will likely return to the 1.0768 support, posing significant challenges for buyers. I would only enter after a false breakout forms there. I plan to open long positions directly on a rebound from 1.0764, aiming for an intraday correction of 30-35 points.
To Open Short Positions on EUR/USD:
Bears made their presence known around 1.0838 but have not managed to offer anything significant since. If the pair rises again after U.S. reports, only a false breakout formation around 1.0838, similar to what I discussed earlier, would provide an entry point for short positions, with the prospect of a decline toward the 1.0811 support, where the moving averages support bullish movement. A breakout and consolidation below this range, followed by a retest from bottom to top, would be another suitable selling opportunity, targeting the 1.0788 level, which would undermine buyers' prospects for further growth. The furthest target would be the 1.0764 zone, where I plan to take profits. If EUR/USD rises in the second half of the day and bears fail to hold the 1.0838 level—which has already proven effective once—buyers could strengthen the correction. In this case, I will postpone selling until the next resistance is tested at 1.0868. I will also sell there, but only after an unsuccessful consolidation. I plan to open short positions directly on a rebound from 1.0900, aiming for a downward correction of 30-35 points.

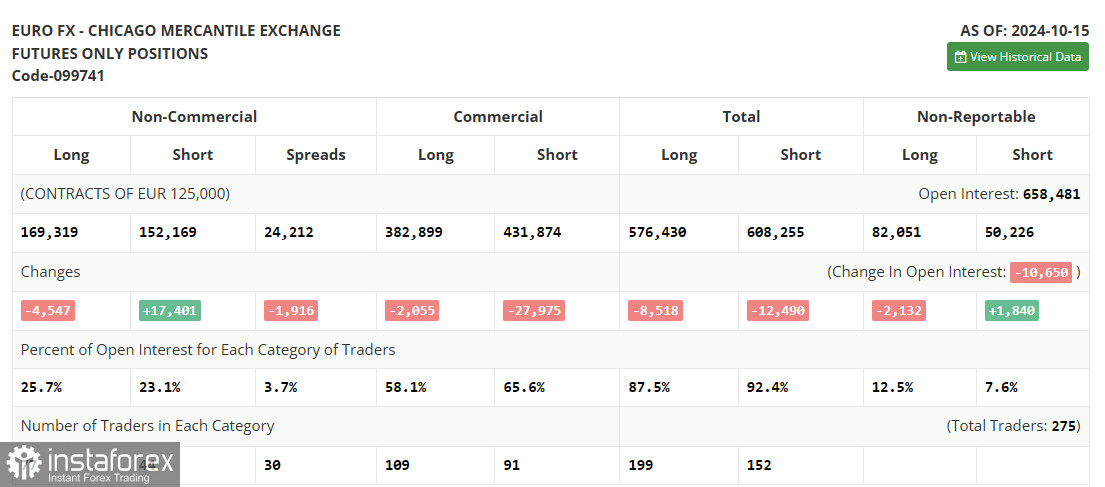
The COT (Commitment of Traders) report from October 15 showed a sharp increase in short positions and another reduction in long positions. It is clear that the data already accounts for the recent decision by the European Central Bank to cut rates, and the focus on a more aggressive policy easing by year-end has clearly shifted the balance of power in the market. Now, buyers of risk assets are no longer leading as strongly, with the balance between the two nearly equal: 169,319 vs. 152,169. This week promises to be relatively calm, as there is virtually no important data, so the bearish outlook for the euro remains. The COT report indicated that long non-commercial positions fell by 4,547 to 169,319, while short non-commercial positions grew by 17,401 to 152,169. As a result, the gap between long and short positions decreased by 1,402.

Indicator Signals:
Moving Averages:
Trading is slightly above the 30 and 50-day moving averages, indicating a correction in the pair.
Note: The period and prices of moving averages are considered by the author on the H1 hourly chart and differ from the classical definition of daily moving averages on the D1 daily chart.
Bollinger Bands:
In the event of a decline, the lower boundary of the indicator around 1.0811 will serve as support.
Indicator Descriptions:
- Moving Average: Determines the current trend by smoothing out volatility and noise. Period – 50, marked in yellow on the chart.
- Moving Average: Determines the current trend by smoothing out volatility and noise. Period – 30, marked in green on the chart.
- MACD (Moving Average Convergence/Divergence): Fast EMA – period 12, Slow EMA – period 26, SMA – period 9.
- Bollinger Bands: Period – 20.
- Non-commercial Traders: Speculators such as individual traders, hedge funds, and large institutions using the futures market for speculative purposes and meeting certain criteria.
- Long Non-commercial Positions: Represent the total long open positions of non-commercial traders.
- Short Non-commercial Positions: Represent the total short open positions of non-commercial traders.
- Total Non-commercial Net Position: The difference between short and long positions of non-commercial traders.
 English
 Русский
 Bahasa Indonesia
 Bahasa Malay
 ไทย
ไทย Español
 Deutsch
 Български
 Français
 Tiếng Việt
 中文
中文 বাংলা
বাংলা हिन्दी
 Čeština
 Українська
 Română

