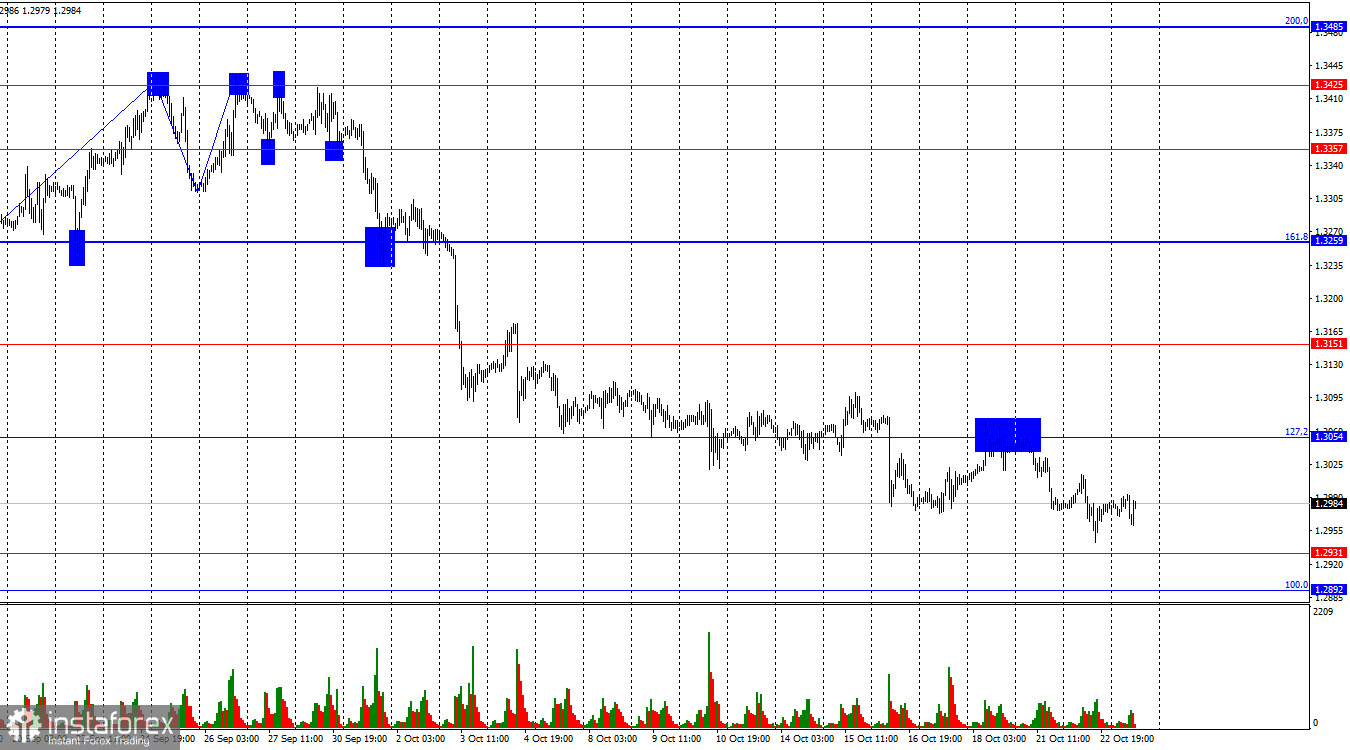
On the hourly chart, the GBP/USD pair continued its decline towards the 1.2931 level on Tuesday. The pound is falling more slowly than at the start of the wave, but it continues to drop. A rebound from either the 1.2931 or 1.2892 level could suggest a reversal in favor of the British pound. This may lead to some upward movement towards the 1.3054 corrective level. A consolidation of the pair's rate below 1.2892 would increase the likelihood of further decline towards the next support zone of 1.2788–1.2801.

The wave structure is clear. The last completed upward wave (September 26) did not surpass the peak of the previous wave, while the downward wave, now in its 19th day, easily broke through the low of the previous wave, which was at the 1.3311 level. Thus, the "bullish" trend is currently considered finished, and a "bearish" trend has begun. A corrective upward wave might be expected from the 1.2931 level, but graphic signals would need to form.
On Tuesday, traders once again had no particular reasons to sell the British pound, but bears still continued their attacks. However, the pound's decline on Monday and Tuesday did not significantly worsen its situation. It has been falling almost daily for nearly four weeks, so one more day of decline makes little difference. Several statements by the Governor of the Bank of England, Andrew Bailey, expected this week could weigh on the pound. The market expects Bailey to maintain or even deepen his "dovish" rhetoric, as the Bank of England has only cut rates once, and inflation in the UK has slowed significantly in recent months. The Bank of England trails the Fed and the ECB significantly, which is not favorable as a "rate divergence" forms. Therefore, Bailey is expected to maintain a "dovish" tone, which does not bode well for the pound. Tomorrow, services and manufacturing PMI indices will be released for the UK, and these reports could be a crucial factor for the pound right now. If these reports are stronger than traders expect, the pound might attempt a rise of 50-60 points, potentially returning to the 1.3054 level.

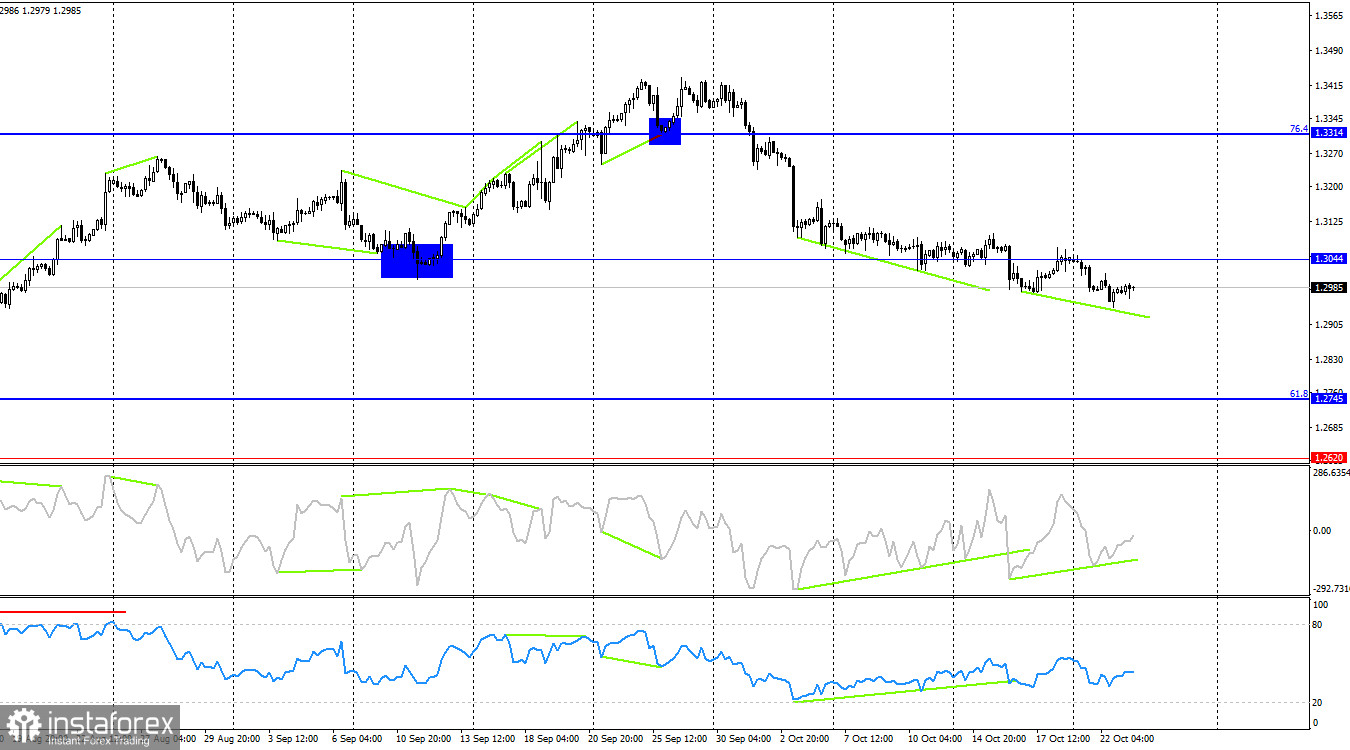
On the 4-hour chart, the pair consolidated below the 1.3044 corrective level, which suggests a further decline towards the next corrective level of 61.8% at 1.2745. "Bullish" divergence has been forming on both indicators for more than a week, but traders are simply ignoring it amid a strong "bearish" trend. A correction will begin eventually, but probably later.
Commitments of Traders (COT) Report:

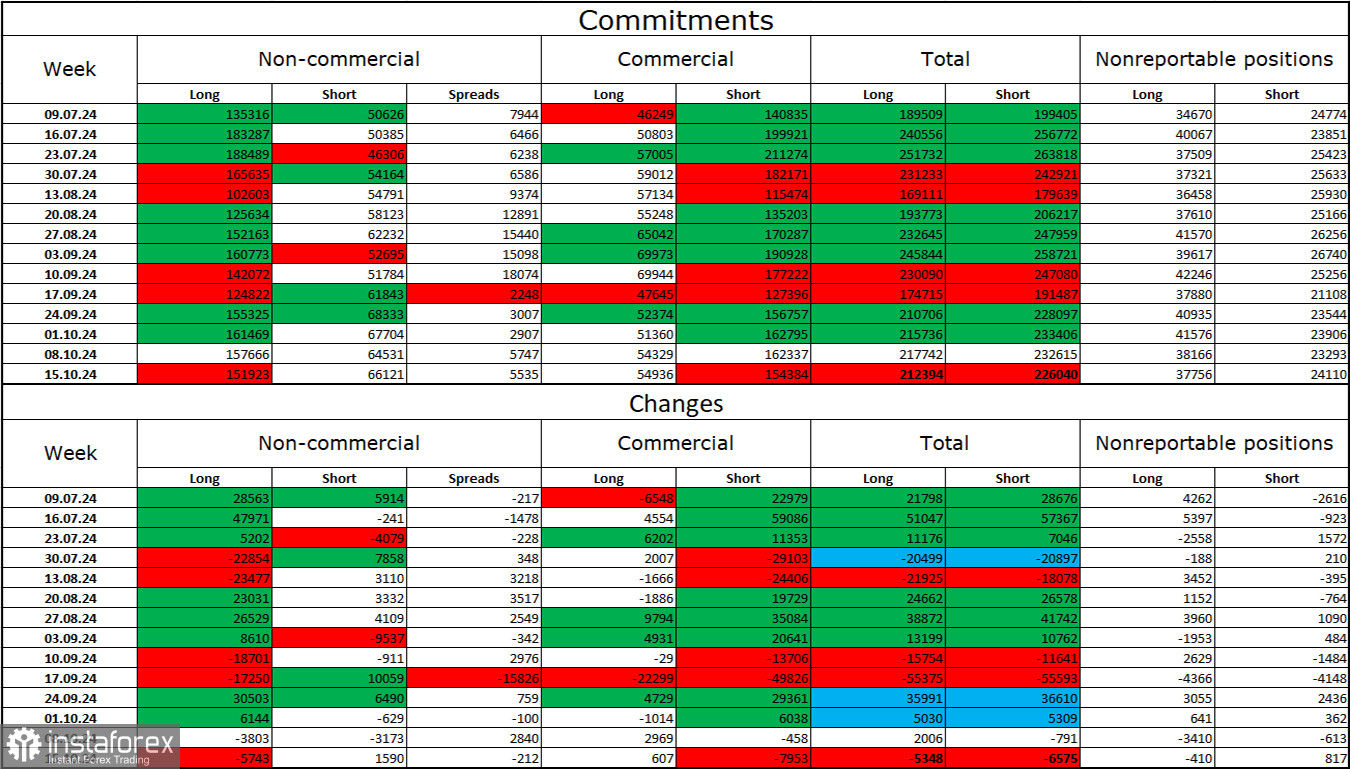
The sentiment among the "Non-commercial" traders category has not changed over the past reporting week and remains "strongly bullish." The number of long positions held by speculators decreased by 5,743, while the number of short positions increased by 1,590 units. The bulls still have a solid advantage. The gap between the number of long and short positions is 86,000: 152,000 against 66,000.
In my view, the pound still faces downward prospects, but the COT reports suggest otherwise. Over the past three months, the number of long positions has grown from 135,000 to 152,000, while short positions increased from 50,000 to 66,000. I believe that, over time, professional players will either reduce their long positions or increase their short positions, as all potential factors for buying the British pound have already been factored in. Graphical analysis suggests that this process could begin soon (or has already begun, judging by the waves).
News Calendar for the US and the UK:
US: Existing Home Sales (14:00 UTC).
On Wednesday, the economic calendar includes only one minor event. The impact of the information background on market sentiment today will be minimal.
Forecast for GBP/USD and Trader Advice:
Sales of the pair were possible upon a rebound on the hourly chart from the 1.3425 level with targets of 1.3357, 1.3259, 1.3151, and 1.3054. All targets have been met. New entries could be made after a close below 1.3044 on the 4-hour chart with a target of 1.2931, and this signal is still active. I don't see any potential signals for buying at this time.
Fibonacci levels are drawn from 1.2892 to 1.2298 on the hourly chart and from 1.4248 to 1.0404 on the 4-hour chart.
 English
 Русский
 Bahasa Indonesia
 Bahasa Malay
 ไทย
ไทย Español
 Deutsch
 Български
 Français
 Tiếng Việt
 中文
中文 বাংলা
বাংলা हिन्दी
 Čeština
 Українська
 Română

