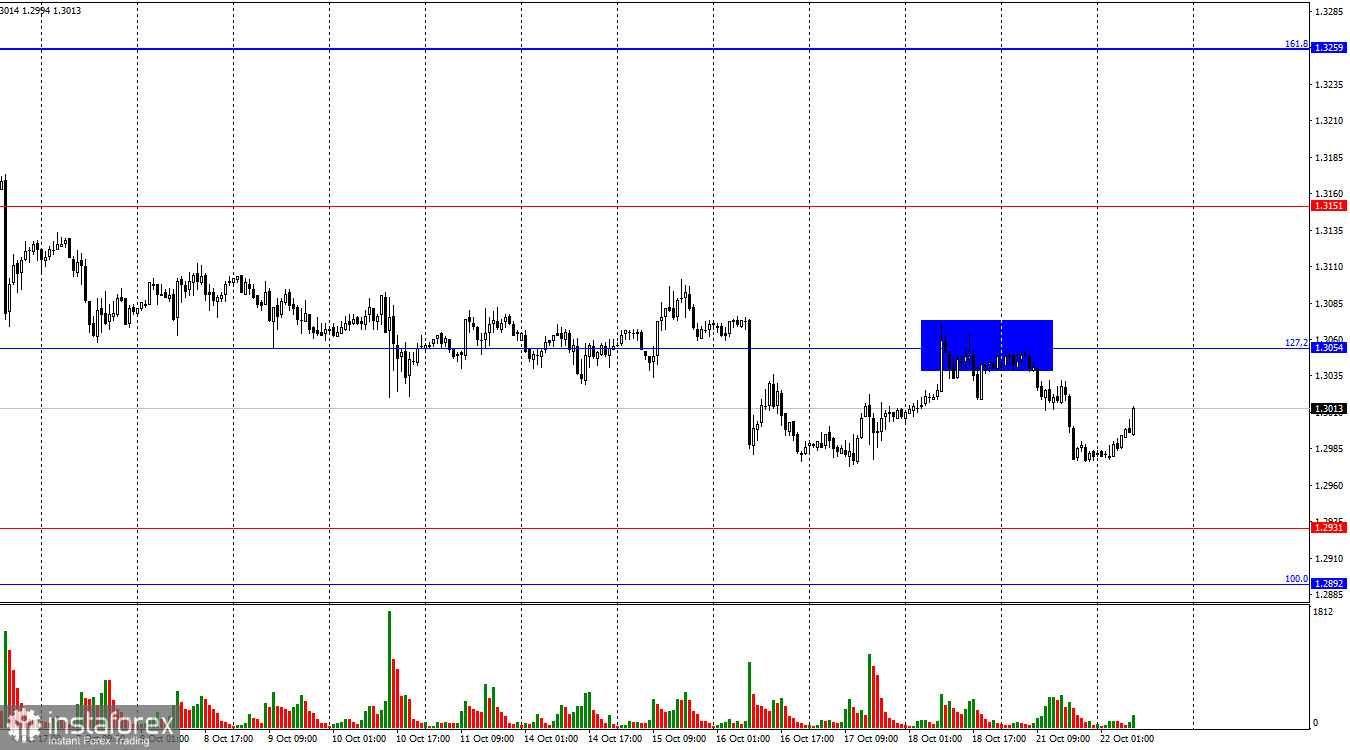
On the hourly chart, the GBP/USD pair rebounded again on Monday from the 127.2% corrective level at 1.3054. It then turned in favor of the dollar, starting a new decline toward the 1.2931 level. This movement is likely to continue today. A consolidation of the pair above the 1.3054 level could allow the pound to show some growth toward the 1.3151 level.

The wave situation is straightforward. The last completed upward wave (September 26) did not break the peak of the previous wave, while the current downward wave, now in its 18th day, has easily broken the low of the previous wave, which was at the 1.3311 level. Therefore, the "bullish" trend is now considered complete, and a "bearish" trend has started to form. A corrective upward wave can be expected from the 1.2931 level, but graphical signals need to be formed.
On Monday, traders did not have many reasons to sell the British pound, yet bears maintained their pressure throughout most of the day. However, Monday's decline did not significantly alter the outlook for the pound, which has been falling almost daily for nearly four weeks. One more day or less makes little difference. This week, several speeches are expected from Bank of England Governor Andrew Bailey, which could pose challenges for the pound. The market expects Bailey to adopt a more "dovish" stance, given that the Bank of England has cut rates only once, while UK inflation has slowed significantly in recent months. The Bank of England lags behind the Fed and the ECB, which is not ideal as it creates a "rate divergence." Thus, Bailey is likely to adopt a "dovish" tone, which does not bode well for the pound. Below the 1.3054 level, I believe that selling remains a viable strategy.

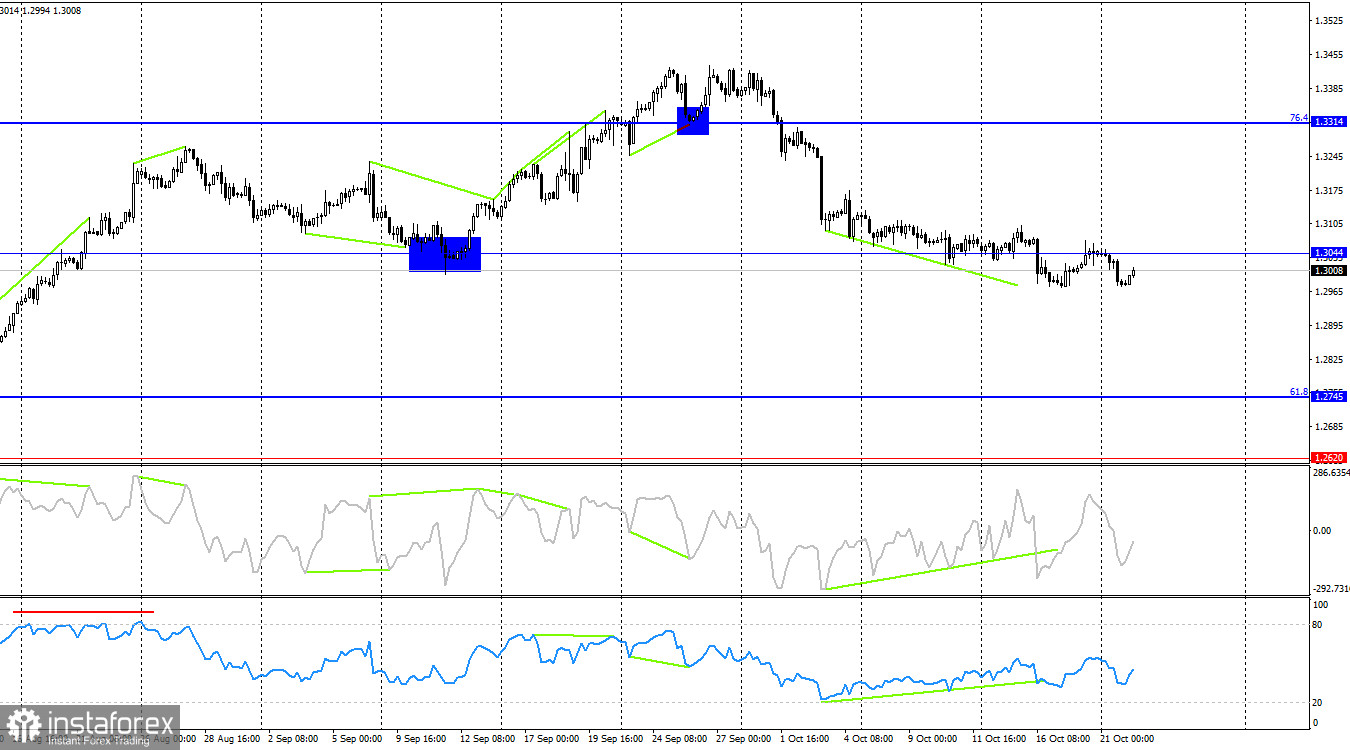
On the 4-hour chart, the pair has consolidated below the 1.3044 corrective level, allowing for further declines toward the next correction level of 61.8% at 1.2745. A "bullish" divergence has been forming for over a week on both indicators, which suggests a potential rebound from the 1.3044 level. However, no rebound has occurred. As a result, the bulls failed to secure a close above this level. The bears indicate that the trend has shifted to a downward one, disregarding the "bullish" divergences. A correction may begin, but likely at a later stage.
Commitments of Traders (COT) Report:

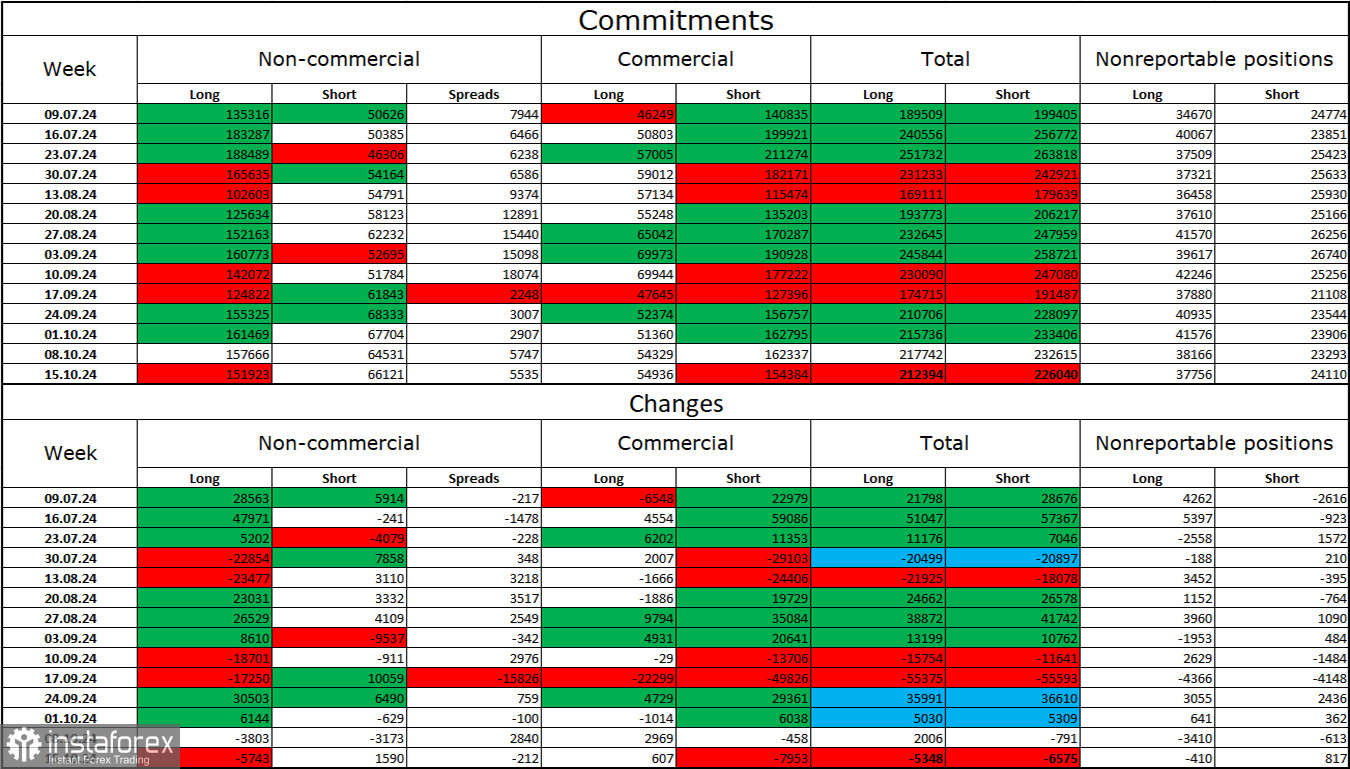
The sentiment among "Non-commercial" traders has not changed in the last report week and remains "strongly bullish." The number of long positions held by speculators decreased by 5,743, while the number of short positions increased by 1,590. The bulls still hold a solid advantage, with a gap between long and short positions of 86,000: 152,000 versus 66,000.
In my view, the pound still faces a downward outlook, but the COT reports currently suggest otherwise. Over the past three months, the number of long positions has risen from 135,000 to 152,000, while short positions have grown from 50,000 to 66,000. I believe that over time, professional traders will either reduce their long positions or increase their short positions, as all possible reasons to buy the British pound have already been reflected in the market valuation. Graphical analysis suggests that this process could start soon (or may have already begun, as indicated by the waves).
News Calendar for the US and UK:
On Tuesday, the economic events calendar contains no significant entries. The impact of the information background on market sentiment is expected to be minimal today.
GBP/USD Forecast and Trader Tips:
Sales of the pair were possible after a rebound on the hourly chart from the 1.3425 level, with targets at 1.3357, 1.3259, 1.3151, and 1.3054. All targets have been met. New positions could be opened after a close below 1.3044 on the 4-hour chart, targeting 1.2931, and this signal remains in effect. I do not see any potential buy signals.
Fibonacci levels are constructed between 1.2892–1.2298 on the hourly chart and 1.4248–1.0404 on the 4-hour chart.
 English
 Русский
 Bahasa Indonesia
 Bahasa Malay
 ไทย
ไทย Español
 Deutsch
 Български
 Français
 Tiếng Việt
 中文
中文 বাংলা
বাংলা हिन्दी
 Čeština
 Українська
 Română

