 English
  Русский
 Bahasa Indonesia
 Bahasa Malay
 ไทย
ไทย Español
 Deutsch
 Български
 Français
 Tiếng Việt
 中文
中文 বাংলা
বাংলা हिन्दी
 Čeština
 Українська
 Română

Analysis of Monday's Trades
1H Chart of the EUR/USD Pair
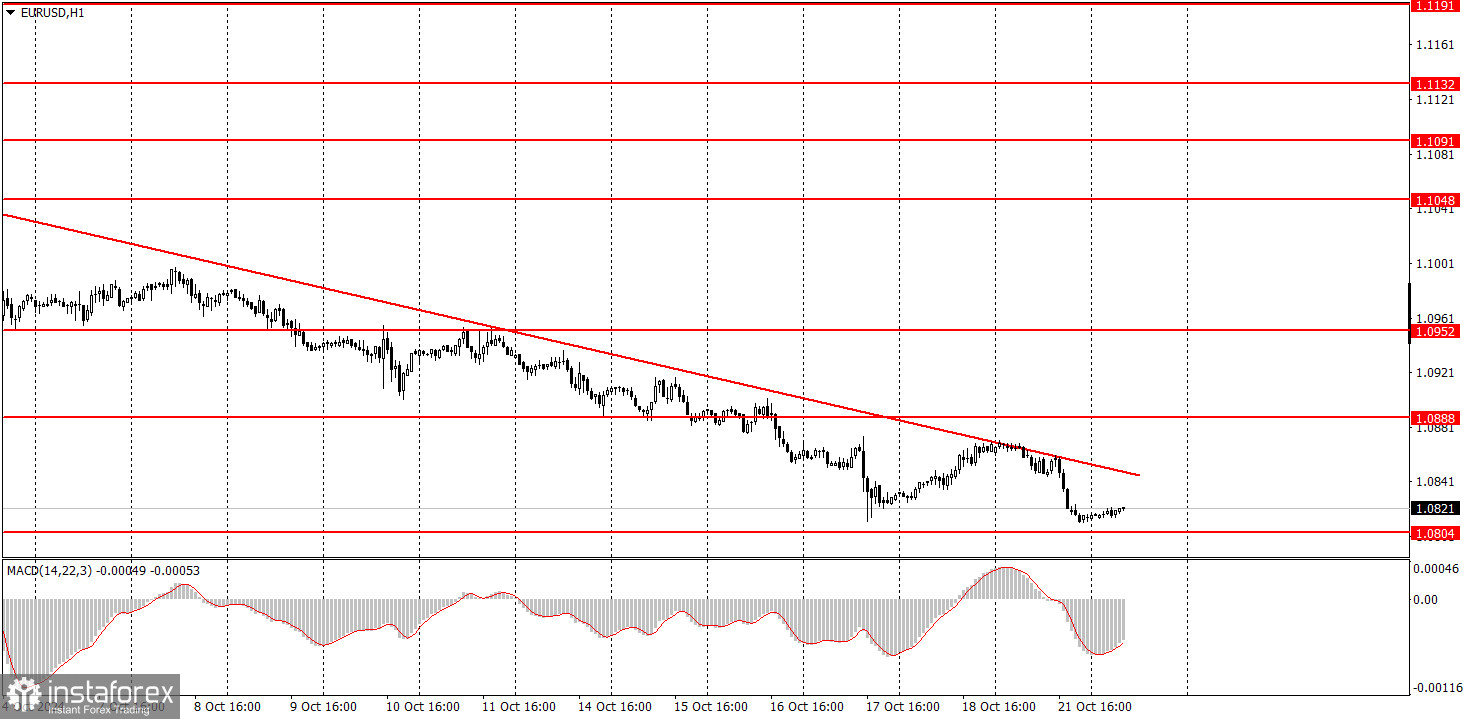
The EUR/USD currency pair showed a downward movement again on Monday. The price bounced back perfectly from the descending trendline and returned to the 1.0804 level and last week's lows. Thus, there is still no basis to suggest that a correction has begun. The euro has been falling for over three weeks, which doesn't surprise us. We've often mentioned that the euro is significantly overbought and unjustifiably expensive. As we can see, the market shows a daily readiness to get rid of the euro, even without any local reasons or grounds. Yesterday, no significant or minor events or reports were in the Eurozone or the United States. Nevertheless, a correction is looming, but it can only be identified if the price consolidates above the trendline. Even then, a substantial rise in the pair is not guaranteed, given the current strength of the bears.
5M Chart of the EUR/USD Pair
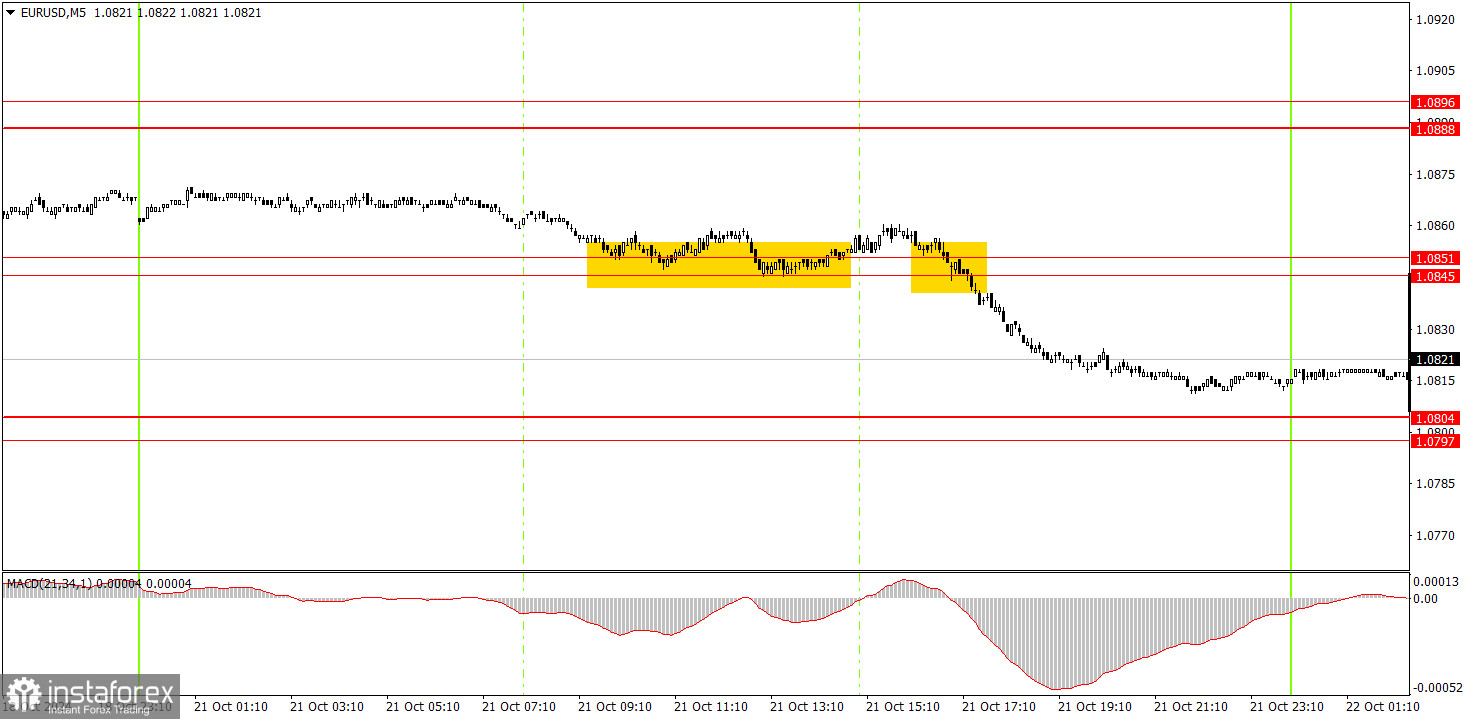
Two trading signals were formed in the 5-minute time frame on Monday. First, the pair attempted to bounce off the 1.0845-1.0851 area but did so hesitantly, having previously bounced off the trendline. Therefore, opening buy trades was not advisable. Then, the pair broke through the specified range, signaling to open short positions. The price continued to fall until the end of the day, allowing traders to close the trade profitably at any point.
How to Trade on Tuesday:
In the hourly time frame, the EUR/USD pair continues to take its first steps toward a new downward trend. This step now looks more like a leap. A correction may begin soon, but there are no signs of its start. Further declines in the euro can be expected even without a correction, as it remains incredibly overbought, though a correction would make things look somewhat more balanced.
On Tuesday, novice traders can trade from the trendline and the 1.0804 level. Short positions are currently much more favorable.
In the 5-minute time frame, the levels to consider are 1.0726-1.0733, 1.0797-1.0804, 1.0845-1.0851, 1.0888-1.0896, 1.0940-1.0951, 1.1011, 1.1048, 1.1091, 1.1132-1.1140, and 1.1189-1.1191. No major events or reports are scheduled for Tuesday in the US or the Eurozone. However, European Central Bank President Christine Lagarde will give two speeches in the EU. We believe Lagarde will not say anything new or significant since the ECB meeting occurred just last week.
Basic Rules of the Trading System:
- The strength of a signal is determined by the time it takes to form (bounce or break through a level). The less time it takes, the stronger the signal.
- If two or more trades were opened with false signals around a certain level, all subsequent signals from that level should be ignored.
- In a flat market, any pair can generate many false signals or none at all. In any case, it's better to stop trading at the first signs of a flat market.
- Trading should be done between the start of the European session and the middle of the American session, after which all trades should be closed manually.
- On the hourly time frame, trade signals from the MACD indicator are best used when there is good volatility and a trend confirmed by a trendline or channel.
- If two levels are too close to each other (5 to 20 pips apart), consider them as a support or resistance zone.
- When the price moves 15 pips in the intended direction, set a Stop Loss to break even.
What's on the Charts:
Support and Resistance Price Levels: These levels serve as targets when opening buy or sell positions. They can also be used as points to set Take Profit levels.
Red Lines: These represent channels or trend lines that display the current trend and indicate the preferred trading direction.
MACD Indicator (14,22,3): The histogram and signal line serve as a supplementary indicator that can also be used as a source of trading signals.
Important Speeches and Reports (always found in the news calendar) can significantly impact the movement of a currency pair. Therefore, trading should be done with maximum caution during their release, or you may choose to exit the market to avoid a sharp price reversal against the preceding movement.
For Beginners Trading on the Forex Market: It's essential to remember that not every trade will be profitable. Developing a clear strategy and practicing money management is key to achieving long-term success in trading.