 English
  Русский
 Bahasa Indonesia
 Bahasa Malay
 ไทย
ไทย Español
 Deutsch
 Български
 Français
 Tiếng Việt
 中文
中文 বাংলা
বাংলা हिन्दी
 Čeština
 Українська
 Română

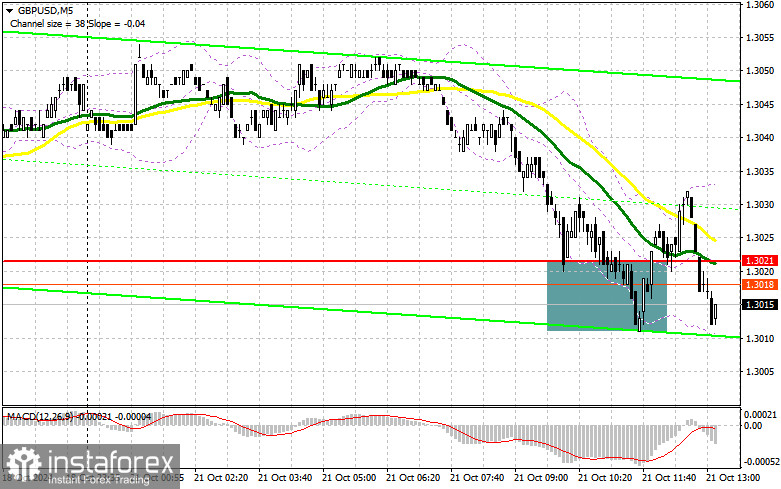
In my morning forecast, I focused on the level of 1.3021 and planned to make trading decisions based on it. Let's look at the 5-minute chart and see what happened. A decline and the formation of a false breakout around 1.3021 provided a suitable entry point for buying the pound, but as you can see on the chart, it did not result in a significant upward movement. The technical outlook for the second half of the day remains unchanged.
To Open Long Positions on GBP/USD:
It is clear that the lack of statistics and trading around the middle of the sideways channel at 1.3021 forces traders to adopt a wait-and-see approach. It is likely that nothing will change in the second half of the day, as the US Leading Indicators Index is unlikely to have a major impact. The speeches by FOMC members Lorie K. Logan and Neel Kashkari could provide insights into future policy but are unlikely to reveal anything new, so I expect the pair to continue trading within the channel. If the pair declines, I will only take action after a false breakout forms near the 1.3021 support area. The target remains the same resistance at 1.3067. A breakout followed by a downward retest of this range would strengthen the chances for a bullish correction, leading to the removal of sellers' stop orders and providing a suitable entry point for a purchase, with the potential to reach 1.3098. Testing this level would disrupt sellers' plans for further declines in the pound. The ultimate target would be the area of 1.3131, where I plan to take profit. If GBP/USD declines and there is no activity from the bulls around 1.3021 in the second half of the day, the bearish trend will resume. This could push the pair lower, leading to a retest of the next weekly low and support at 1.2976. Only a false breakout formation there would be a suitable condition for opening long positions. I plan to buy GBP/USD if it rebounds from the 1.2941 low, targeting a 30-35 point correction within the day.
To Open Short Positions on GBP/USD:
Sellers tried but did not manage to make a significant impact. Without support from major market participants, volatility has decreased. The main goal for the bears is to defend the resistance at 1.3067, where the formation of a false breakout could provide a good opportunity for selling, targeting a decline to the support at 1.3021, which serves as the middle of the sideways channel. The moving averages are also situated in this area. Therefore, a break and a retest from bottom to top of this range could undermine buyers' positions, leading to the removal of stop orders and opening the way to 1.2976. The ultimate target would be the area of 1.2941, where I will take profit. Testing this level could revive the bearish trend. If GBP/USD rises and there is no activity around 1.3067 in the second half of the day, buyers will try to regain the initiative. In that case, the bears will have no choice but to retreat to the resistance area of 1.3098. I will sell there only after a false breakout. If there is no downward movement there, I will look for short positions on a rebound around 1.3131, but only for a downward correction of 30-35 points within the day.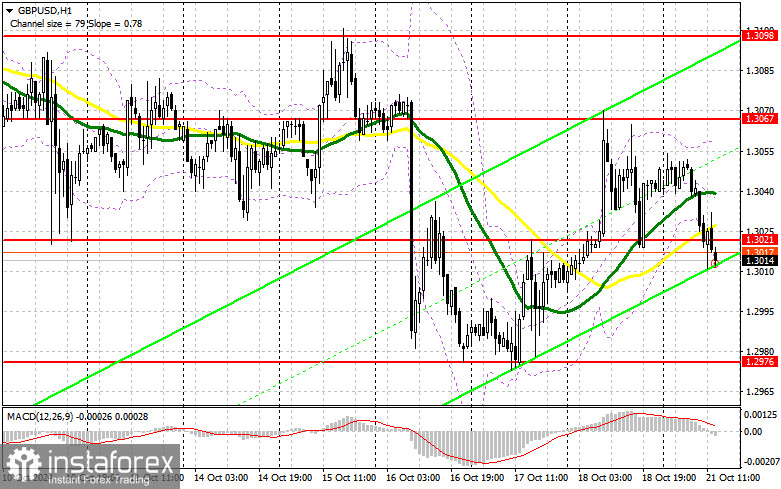
In the COT report (Commitment of Traders) for October 8, there was a decrease in both long and short positions, almost by the same amount. Recent data from the UK has not helped the pound rise, but at least it has kept the pair within a rather significant sideways channel, which could eventually lead to the end of the bearish market and the formation of a new bullish trend. However, for this to happen, US policymakers would need to start talking about actively cutting interest rates again, which seems unlikely in the current conditions. The latest COT report shows that long non-commercial positions decreased by 3,803 to 157,666, while short non-commercial positions fell by 3,173 to 64,531. As a result, the gap between long and short positions increased by 2,840.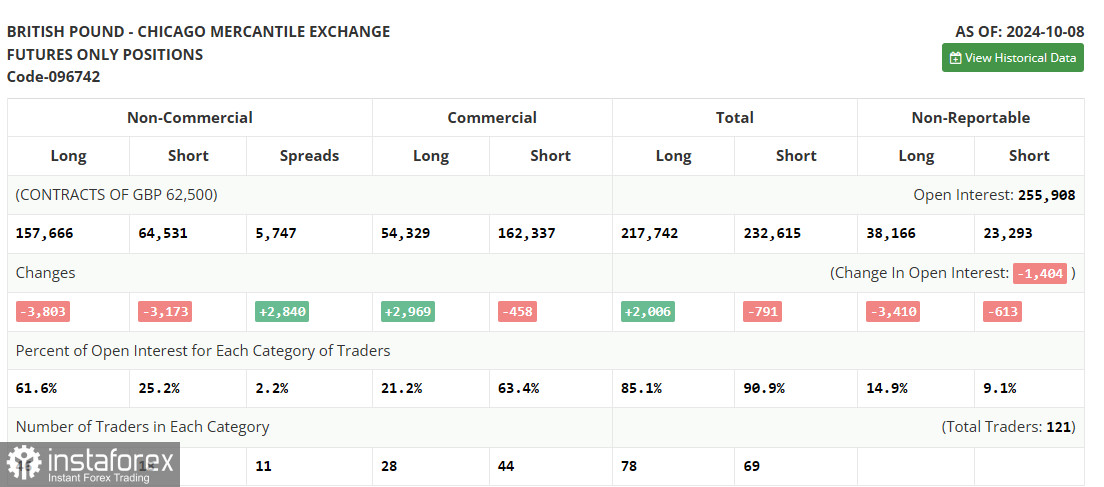
Indicator Signals:
Moving Averages
Trading is occurring around the 30- and 50-day moving averages, indicating a range-bound market.
Note: The period and prices of the moving averages are considered by the author on the hourly H1 chart and differ from the general definition of classic daily moving averages on the D1 chart.
Bollinger Bands
In the event of a decline, the lower boundary of the indicator around 1.3021 will serve as support.
Indicator Descriptions:
- Moving Average (MA): Determines the current trend by smoothing out volatility and noise. Period 50, marked in yellow on the chart.
- Moving Average (MA): Determines the current trend by smoothing out volatility and noise. Period 30, marked in green on the chart.
- MACD Indicator (Moving Average Convergence/Divergence): Fast EMA period 12, Slow EMA period 26, SMA period 9.
- Bollinger Bands: Period 20.
- Non-commercial traders: Speculators such as individual traders, hedge funds, and large institutions using the futures market for speculative purposes and meeting certain criteria.
- Long non-commercial positions: Represent the total long open positions of non-commercial traders.
- Short non-commercial positions: Represent the total short open positions of non-commercial traders.
- Total non-commercial net position: The difference between the short and long positions of non-commercial traders.