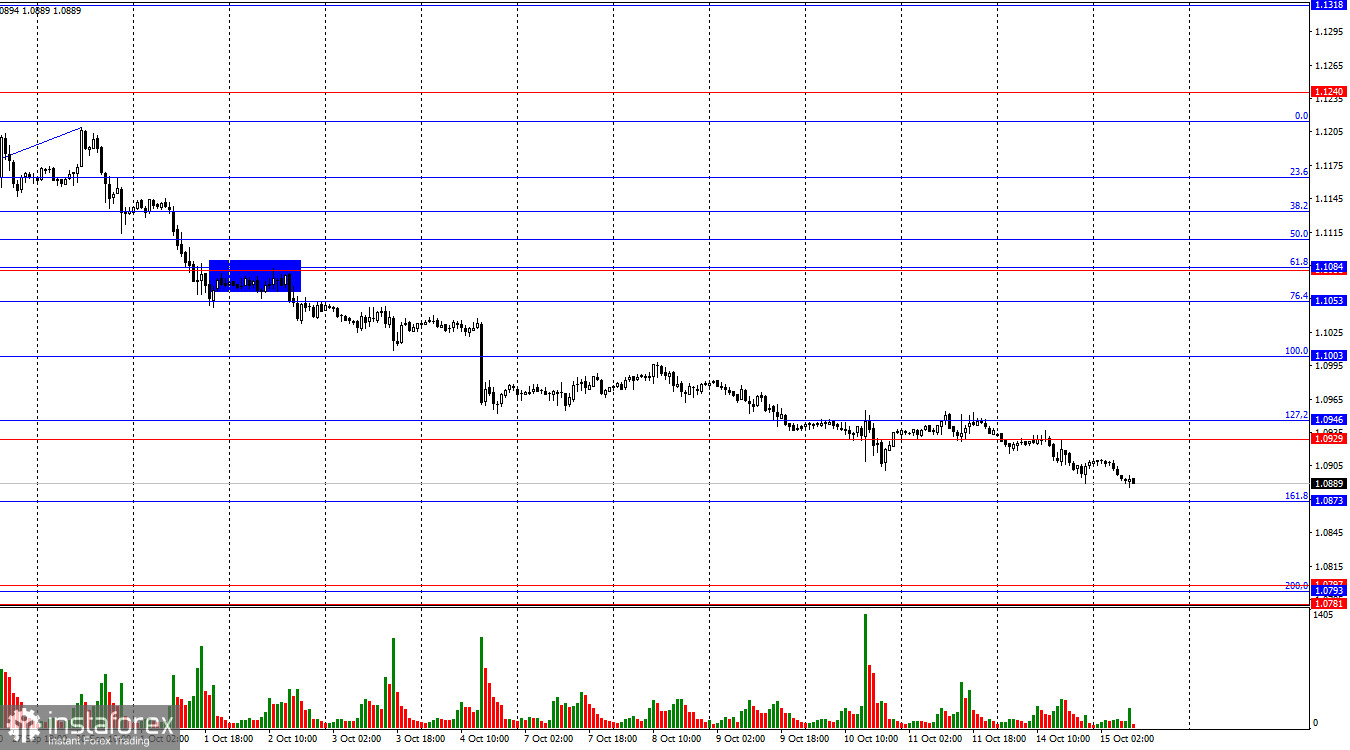
The EUR/USD pair continued its decline on Monday toward the 161.8% corrective level at 1.0873. The fall continues this morning, with just a few points left to reach the target. A rebound from this level could lead to some recovery in the euro, but at the moment, I see no reasons for a strong correction. Perhaps favorable news may support the bulls after the ECB meeting, but for now, there's nothing that could help them.

The wave situation has become a bit more complicated in recent weeks, but overall, it's still clear. The last completed upward wave (September 25–30) did not break the peak of the previous wave, and the new downward wave (still forming) has already broken the lows of the previous three waves. Thus, the pair is currently forming a new bearish trend. We might see a corrective wave soon, but the bulls have already lost their grip on the market. Regaining control of the market will require significant effort.
There was no significant news on Monday. Not a single event could stop the euro's decline. But does the fall need to be stopped? The bulls have long been preparing for the easing of the Fed's monetary policy, but they can't keep pushing during the anticipation, the beginning of the process, or throughout the process itself, which may last a couple of years. That's simply illogical. Therefore, I believe the trend has shifted globally, not just for a few weeks. The bears have taken control, as the wave patterns clearly show. I now expect a further decline in the euro. Previously, the news flow often supported the euro; now it will favor the dollar. The ECB meeting could worsen the euro's issues. The currency has been at its peak for too long.

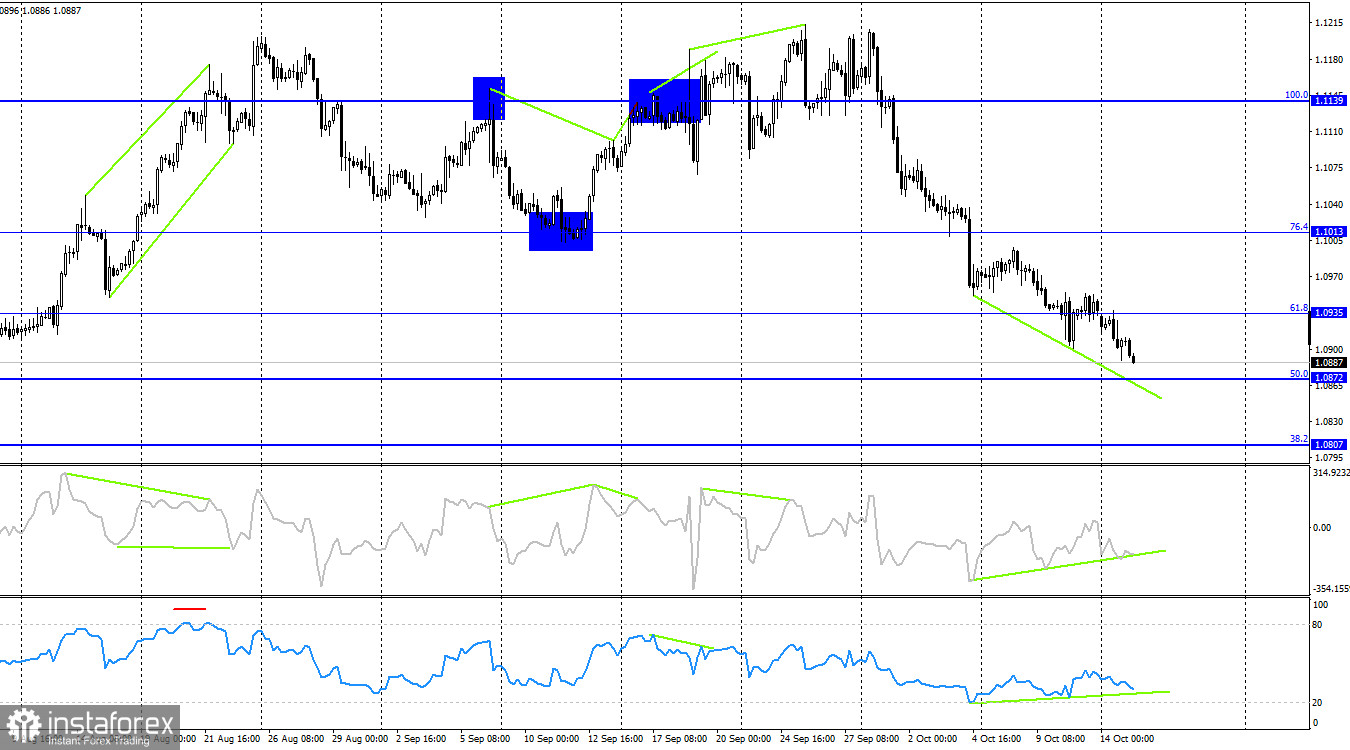
On the 4-hour chart, the pair continues its decline toward the 50.0% Fibonacci level at 1.0872. Both indicators currently show bullish divergences, but these only point to a potential correction since the trend has shifted to bearish. The lack of reaction to these divergences (i.e., their failure to play out) proves that the trend has turned bearish, as traders are simply ignoring them. A rebound from the 1.0872 level would signal some upward movement, while a break below this level would suggest further decline toward the next corrective level at 38.2%, which is 1.0807.
COT Report:
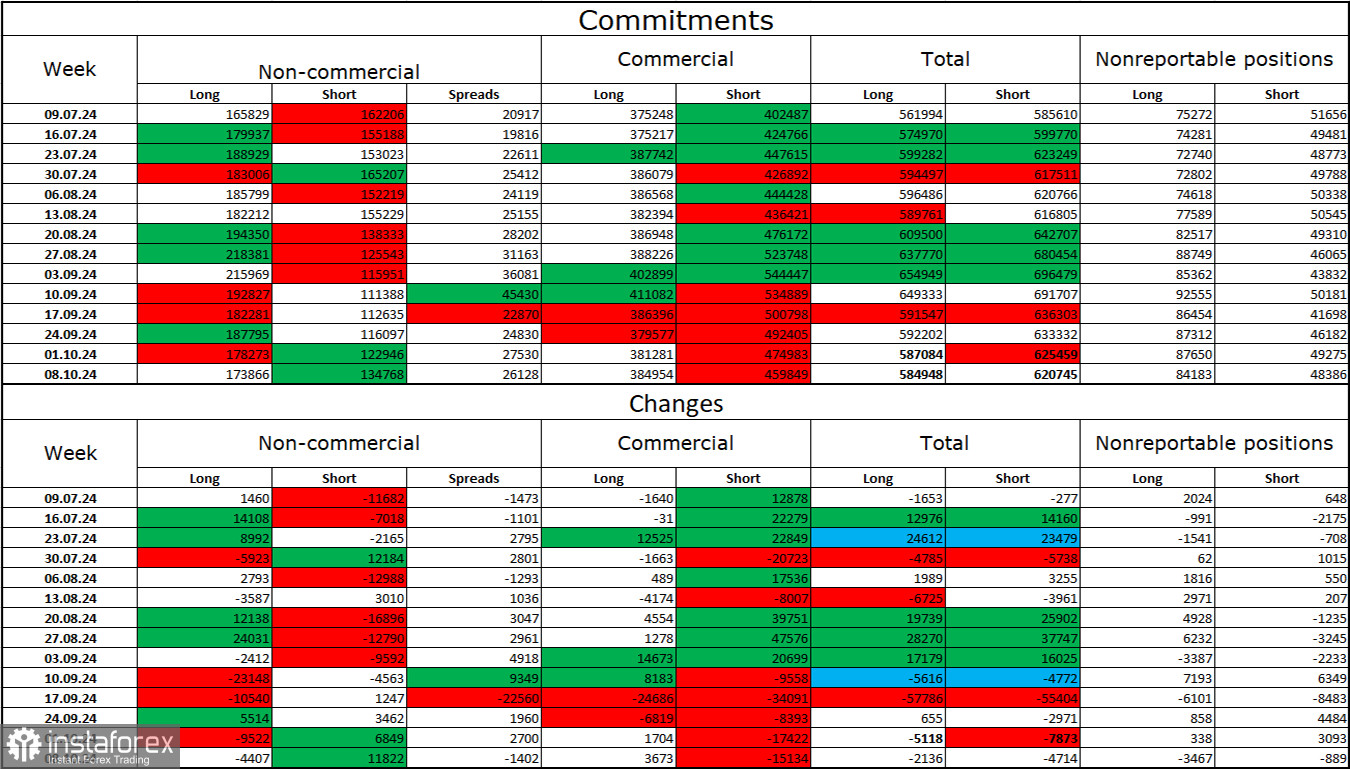
In the latest reporting week, speculators closed 4,407 long positions and opened 11,822 short positions. The sentiment of the "Non-commercial" group turned bearish several months ago, but bulls are currently dominating again. The total number of long positions held by speculators now stands at 174,000, while short positions total 135,000.
However, for five consecutive weeks, major players have been offloading the euro. In my opinion, this could be a precursor to a new bearish trend or at least a significant correction. The key factor in the dollar's decline—the expectation of the Fed's monetary policy easing—has already played out, and the dollar no longer has strong reasons to fall. While new factors may emerge over time, the likelihood of the dollar strengthening is greater at the moment. Chart analysis also indicates the start of a bearish trend. Thus, I am preparing for an extended decline in the EUR/USD pair.
News calendar for the U.S. and the Eurozone:
Eurozone – Change in industrial production volume (09:00 UTC)
The economic calendar for October 15 includes just one relatively unimportant report. Therefore, the impact of the news flow on trader sentiment will be minimal today.
EUR/USD forecast and trading advice:
Selling opportunities arose when the pair closed below 1.1139 on the 4-hour chart, with targets at 1.1081, 1.1070, 1.1013, and 1.0984. All targets have been reached. I don't see new sell signals at the moment. I would consider buying the pair if it rebounds from the 1.0873 level, but it's important to remember that the trend has shifted to bearish.
Fibonacci levels are based on 1.1003–1.1214 on the hourly chart and 1.1139–1.0603 on the 4-hour chart.
 English
 Русский
 Bahasa Indonesia
 Bahasa Malay
 ไทย
ไทย Español
 Deutsch
 Български
 Français
 Tiếng Việt
 中文
中文 বাংলা
বাংলা हिन्दी
 Čeština
 Українська
 Română

