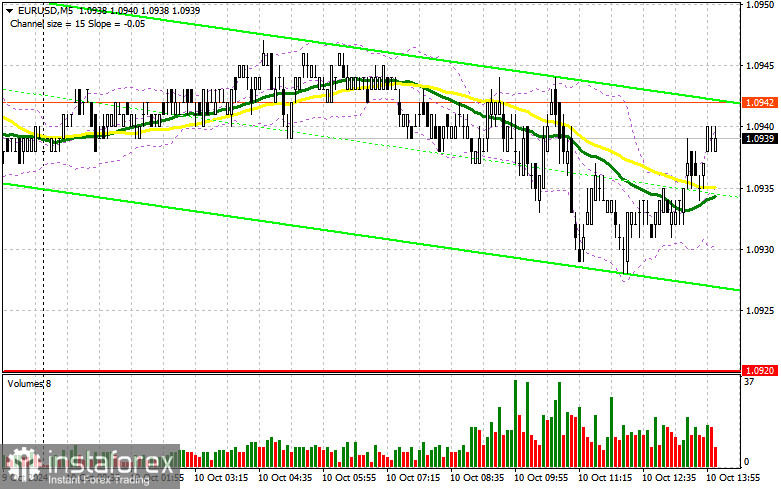
In my morning forecast, I focused on the level of 1.0920 and planned to make decisions based on it. We will review the 5-minute chart to analyze what occurred. A decline occurred, but due to low market volatility amid the lack of data, we failed to reach the 1.0920 level. The technical picture for the second half of the day has not changed.

To Open Long Positions on EUR/USD:
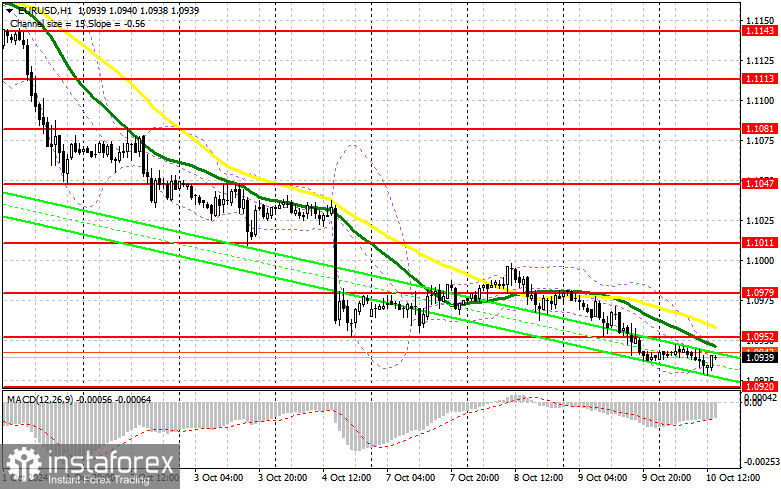
The lack of key data and resulting low volatility are understandable, particularly ahead of a significant report related to U.S. inflation. The Consumer Price Index (CPI) and the Core CPI excluding food and energy prices for September are the factors that could impact the dollar later this week. News of substantial deflationary data could encourage selling of the dollar and buying of the euro. The initial jobless claims data in the U.S. is expected to have a limited market impact. I plan to follow a similar strategy as in the first half of the day. In the event of a decline in the pair and a bearish reaction to the data, a false breakout around the 1.0920 support area would provide a favorable condition for entering long positions, opening the way to the 1.0952 level. A breakout and a retest of this range will confirm a good entry point for buying, aiming for 1.0979. The final target would be the 1.1011 high, where I plan to take profit. If EUR/USD continues to decline and there is no bullish activity around 1.0920 in the second half of the day, pressure on the euro will remain. In that case, I will only consider entering after a false breakout has formed around the next support at 1.0884. I will open long positions immediately from the 1.0855 low with a target for a 30-35 point upward correction during the day.
To Open Short Positions on EUR/USD:
Sellers remain in control of the market. If there are very soft inflation figures, a brief rise in the euro could occur, which, together with a false breakout at 1.0952 where the moving averages are located, will provide a good entry point for new short positions, aiming for a further decline toward the 1.0920 support. A breakout and subsequent retest of the 1.0920 range from below would provide another opportunity for selling, targeting the 1.0884 level, further reinforcing the bearish market. Only at this support level do I anticipate a stronger buying interest from bulls. The final target would be the 1.0855 level, where I plan to take profit. If EUR/USD rises in the second half of the day and sellers are absent at 1.0952, buyers may have an opportunity for a slight recovery in the pair toward the end of the week. In that case, I will postpone selling until the next resistance at 1.0979. There, I will also sell, but only after a failed consolidation attempt. I will open short positions immediately on a rebound from 1.1011, aiming for a 30-35 point downward correction.

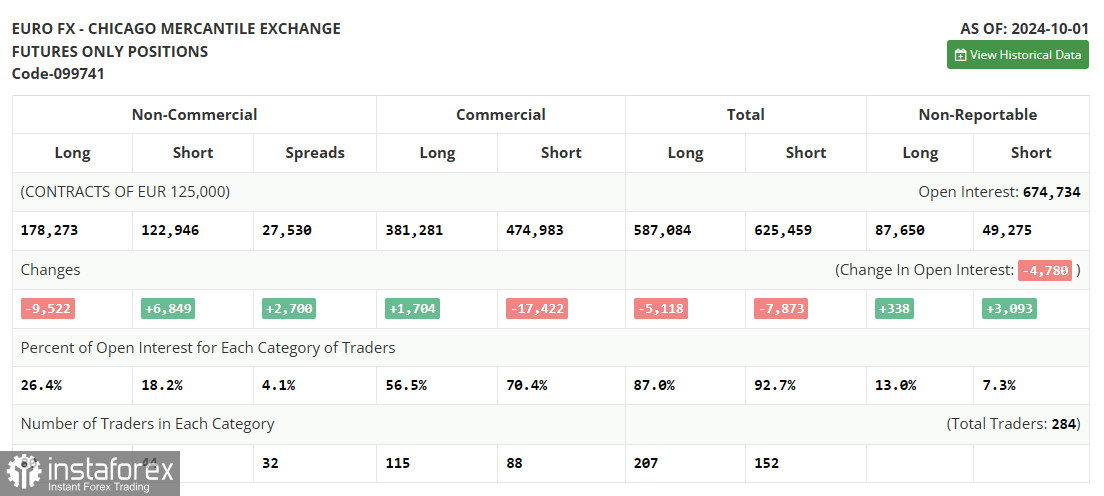
In the Commitment of Traders (COT) report for October 1, there was a slight increase in short positions and a sharp reduction in long positions, leading to a shift in market balance toward sellers. It is clear that recent U.S. labor market data, which outperformed economists' forecasts, currently plays a key role in the Federal Reserve's future decisions, which are expected to be less abrupt and unexpected. The central bank is likely to adopt a more measured approach to rate cuts in the future, which could positively affect the strength of the U.S. dollar. However, this does not negate the medium-term upward trend for the pair. The lower the pair declines, the more attractive it becomes for buyers. The COT report indicated that long non-commercial positions decreased by 9,522, to 178,273, while short non-commercial positions increased by 6,849, to 122,946. As a result, the gap between long and short positions widened by 2,700.
Indicator Signals:
Moving Averages:
Trading is conducted around the 30 and 50-day moving averages, indicating market uncertainty.
Note: The period and prices of the moving averages are considered by the author on the H1 hourly chart and differ from the standard definition of classic daily moving averages on the D1 daily chart.
Bollinger Bands:
In the event of a decline, the lower boundary of the indicator at around 1.0925 will serve as support.
Description of Indicators:
- Moving average (determines the current trend by smoothing volatility and noise). Period – 50. Marked in yellow on the chart.
- Moving average (determines the current trend by smoothing volatility and noise). Period – 30. Marked in green on the chart.
- MACD Indicator (Moving Average Convergence/Divergence). Fast EMA – period 12. Slow EMA – period 26. SMA – period 9.
- Bollinger Bands. Period – 20.
- Non-commercial traders – speculators such as individual traders, hedge funds, and large institutions that use the futures market for speculative purposes and meet certain requirements.
- Long non-commercial positions represent the total open long positions held by non-commercial traders.
- Short non-commercial positions represent the total open short positions held by non-commercial traders.
- Net non-commercial position is the difference between the short and long positions of non-commercial traders.
 English
 Русский
 Bahasa Indonesia
 Bahasa Malay
 ไทย
ไทย Español
 Deutsch
 Български
 Français
 Tiếng Việt
 中文
中文 বাংলা
বাংলা हिन्दी
 Čeština
 Українська
 Română

