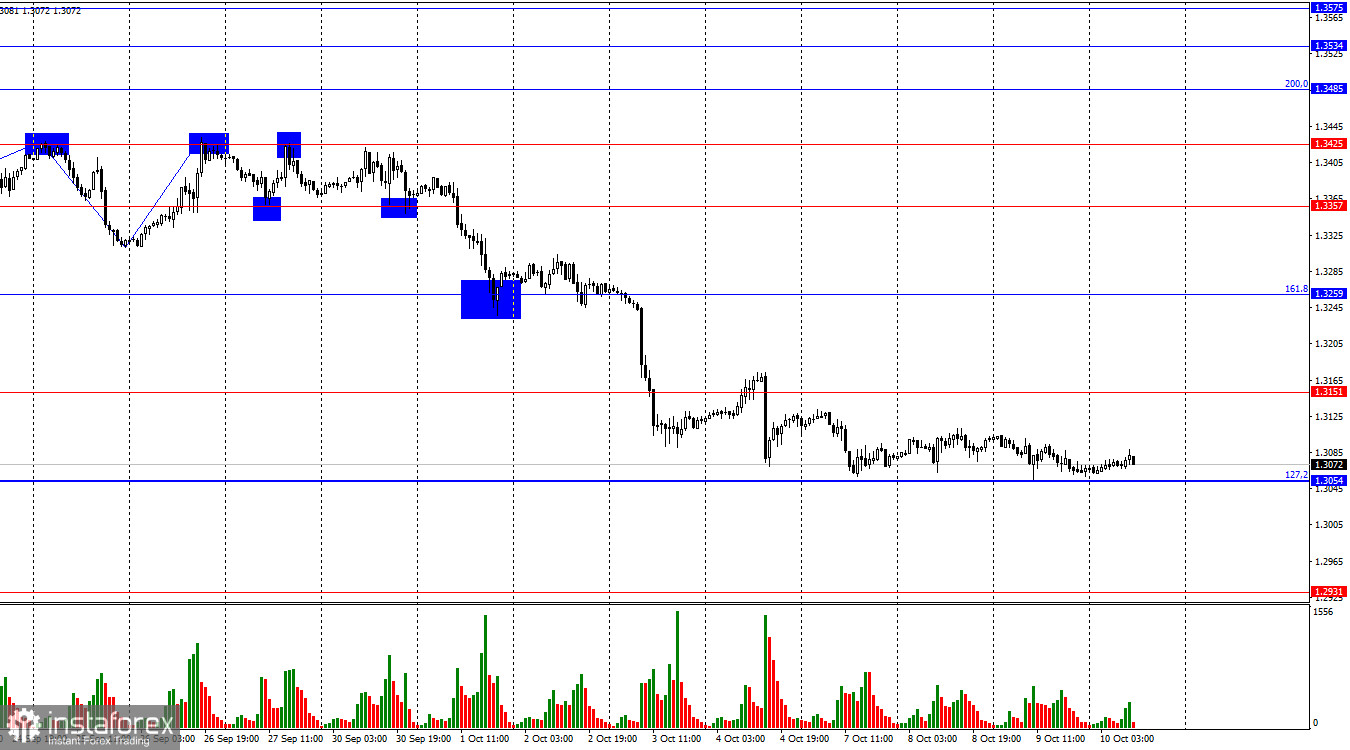
On the hourly chart, the GBP/USD pair fell to the 127.2% corrective level at 1.3054 on Wednesday, but there was no subsequent increase. Bears continue to push the rate down, and the chart suggests that a close below the 1.3054 level is likely. The price has tried to rebound from this level several times without success. A consolidation below 1.3054 could signal a further decline toward the 1.2931 level.

The situation with the waves raises no questions. The last completed upward wave (September 26) did not break the peak of the previous wave, while the downward wave that has been forming for nine days easily broke the low of the previous wave, which was at 1.3311. Therefore, the bullish trend is now considered over, and the formation of a bearish trend is underway. From the 1.3054 level, I expect a corrective wave upward.
The FOMC minutes released on Wednesday had no impact on trader sentiment, and there were no other major news releases. Today, the market is awaiting the U.S. inflation report. Recently, the market has been dovish regarding the Fed's monetary policy; however, this no longer seems to matter much for the U.S. dollar, which has been declining for too long. For the dollar to halt its appreciation, today's Consumer Price Index (CPI) would need to show a very weak reading. Traders anticipate headline inflation to fall to 2.3%, with core inflation remaining at 3.2%. Thus, either headline or core inflation would need to drop by 0.2%-0.3% below forecasts for the dollar to stop appreciating. The Fed continues to closely monitor inflation data, so a faster slowdown in inflation would indicate the need for a quicker rate cut. The FOMC minutes revealed that many members do not support the idea of a second consecutive 0.50% rate cut, but their views may change after the inflation report.

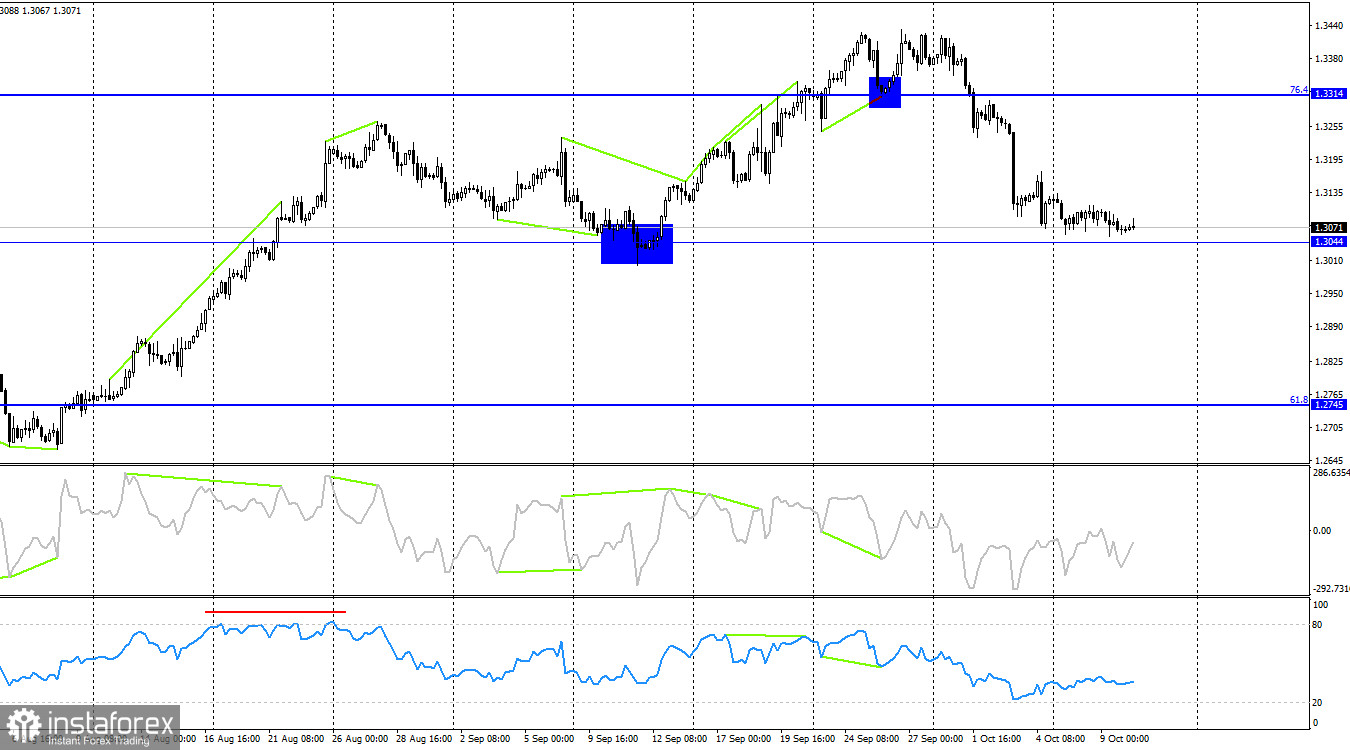
On the 4-hour chart, the decline continues toward the next level of 1.3044, which is now close. Over the past few days, a bullish divergence has been forming on both indicators, suggesting a potential upward rebound. A rebound from the 1.3044 level could indicate some growth, but it's crucial for the bears to secure a close below this level to continue the decline toward the 61.8% Fibonacci level at 1.2745.
Commitments of Traders (COT) Report:

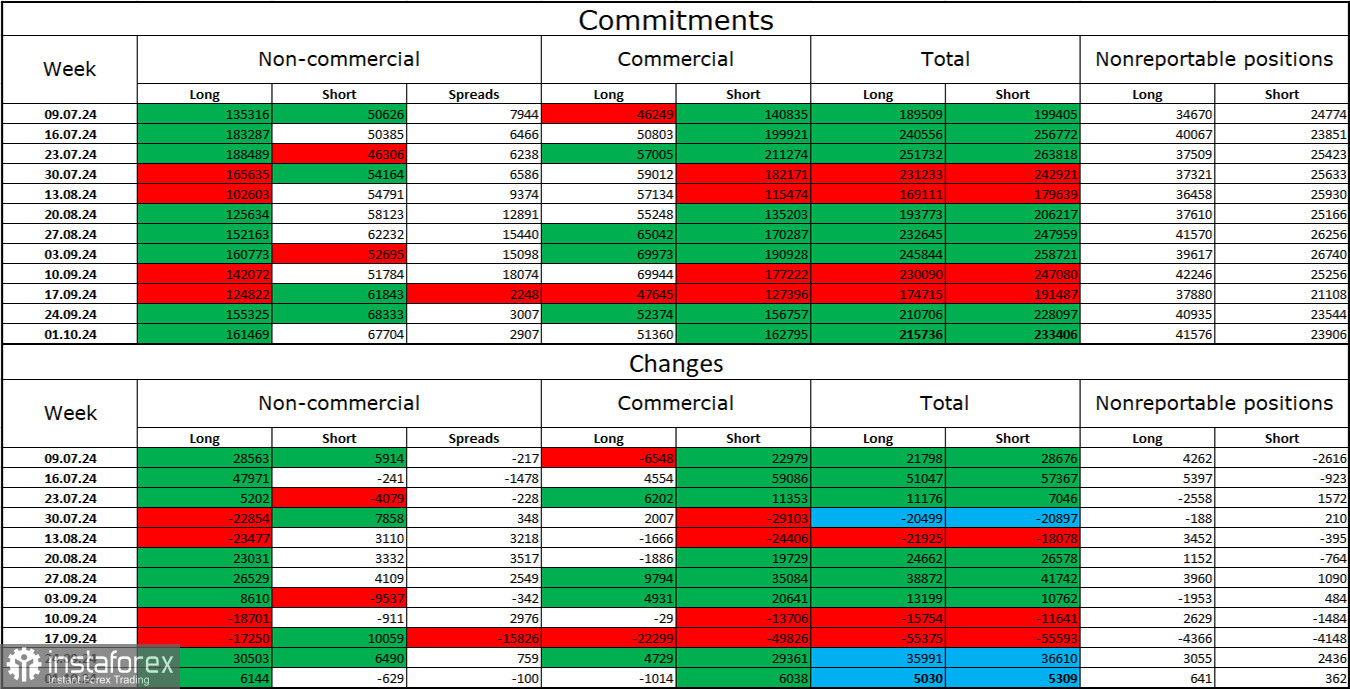
The sentiment among non-commercial traders became more bullish in the latest reporting week. The number of long positions held by speculators increased by 6,144, while the number of short positions decreased by 629. In the previous two weeks, professional players were reducing their long positions and increasing short positions, but they have now resumed buying the pound. Bulls still hold a solid advantage, with a gap of 93,000: 161,000 long positions against 68,000 short positions.
In my view, the pound still has potential for further decline, but the COT reports suggest otherwise. Over the past three months, the number of long positions has grown from 135,000 to 161,000, while short positions have increased from 50,000 to 68,000. I believe that over time, professional traders will start reducing their long positions or increasing short positions since all potential buying factors for the pound have already played out. Chart analysis suggests that this process could begin soon.
Economic Calendar for the U.S. and the UK:
- U.S. – Consumer Price Index (12:30 UTC)
- U.S. – Change in Initial Jobless Claims (12:30 UTC)
Thursday's economic calendar includes two key events; one of them is extremely important. The impact of the informational background on market sentiment could be strong today.
Forecast for GBP/USD and Trading Advice:
Selling the pair was possible following a rebound from the 1.3425 level on the hourly chart, with targets at 1.3357 and 1.3259. Both targets have been achieved. A close below 1.3259 allowed further selling with a target of 1.3151, and a close below 1.3151 targeted 1.3054. All targets have been met. I believe that selling positions can now be closed. New selling opportunities can be initiated if the price closes below 1.3044, targeting 1.2931. Buying opportunities may arise from a bounce at 1.3044 on the 4-hour chart, with a target of 1.3151.
Fibonacci levels are drawn from 1.2892–1.2298 on the hourly chart and from 1.4248–1.0404 on the 4-hour chart.
 English
 Русский
 Bahasa Indonesia
 Bahasa Malay
 ไทย
ไทย Español
 Deutsch
 Български
 Français
 Tiếng Việt
 中文
中文 বাংলা
বাংলা हिन्दी
 Čeština
 Українська
 Română

