 English
  Русский
 Bahasa Indonesia
 Bahasa Malay
 ไทย
ไทย Español
 Deutsch
 Български
 Français
 Tiếng Việt
 中文
中文 বাংলা
বাংলা हिन्दी
 Čeština
 Українська
 Română

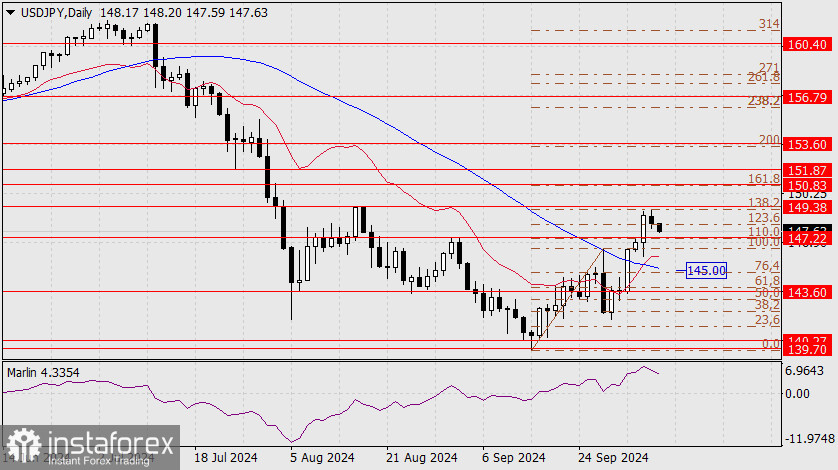
On Monday, the yen fell slightly short of reaching the target 149.38 (the August 15 peak) but accurately tested the 138.2% Fibonacci reaction level on the daily chart.
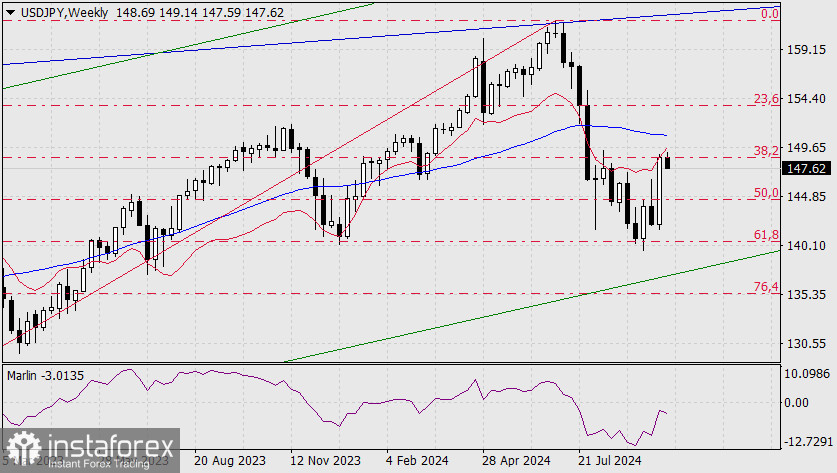
On the weekly chart, the price also worked through the 38.2% Fibonacci level at its intersection with the balance line. A price reversal is highly likely.
Thus, after the price consolidates below the 147.22 level, the target will open at the MACD line on the daily chart near the 76.4% Fibonacci level. The Marlin oscillator on the daily chart is turning around.
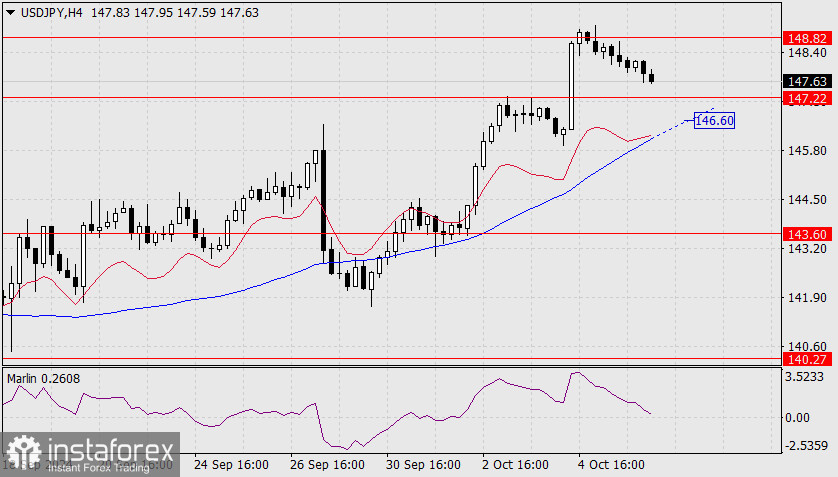
On the four-hour chart, the price slowly approaches the support at 147.22, with the Marlin oscillator approaching the border of the downtrend zone. After breaking the support and then the MACD line (146.60), the price will reach 145.00.