Analysis of GBP/USD 5M

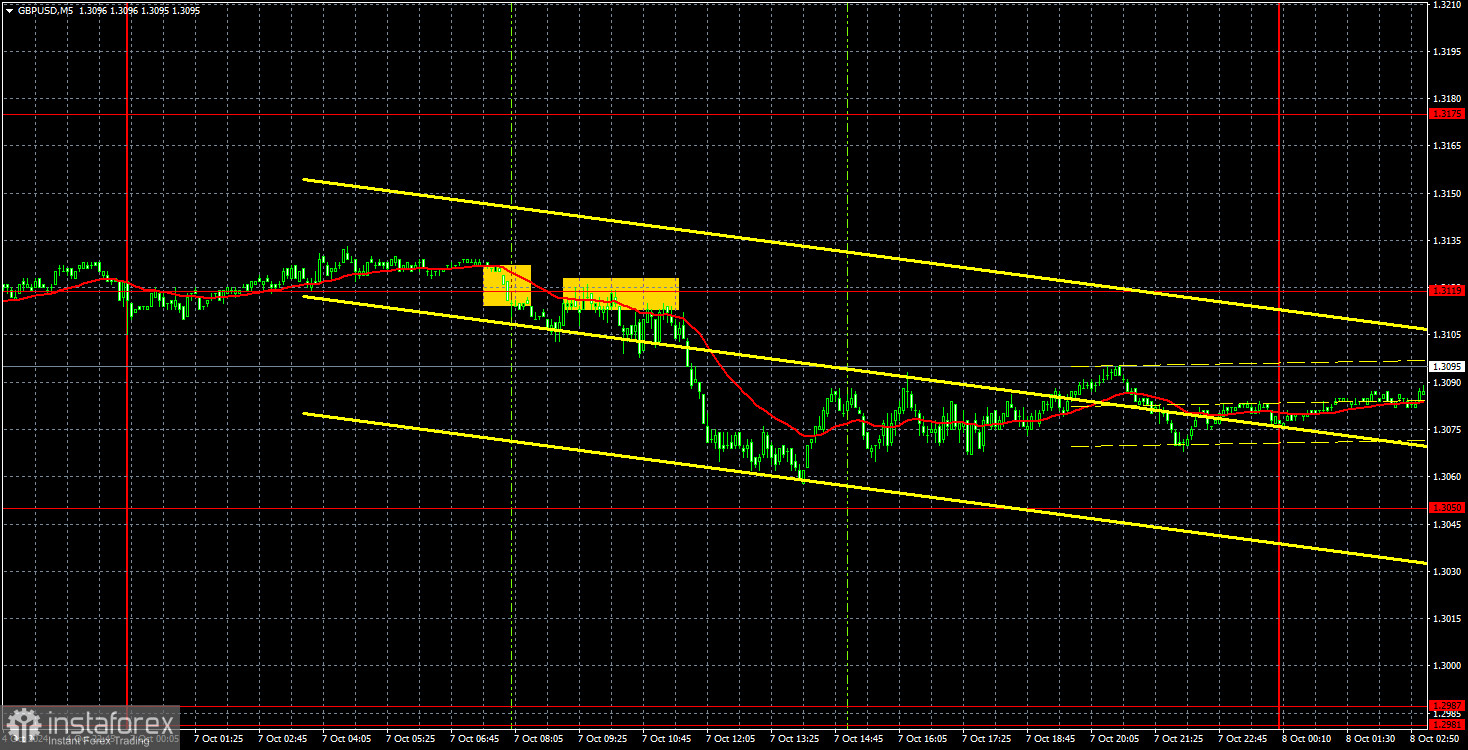
On Monday, the GBP/USD currency pair traded with low volatility and showed minimal desire to correct. The British pound is gradually sliding downward, which is logical and expected. There were no significant events in the UK or the US on Monday, so the pound managed to avoid further decline this time. However, it's time for a slight upward correction. There will be very few major events this week, so volatility may remain low. Only on Thursday will the market closely watch the US inflation report, which could trigger strong market movements. On the other days, only secondary events are expected.
For the British pound, much now depends not only on the Federal Reserve's monetary policy and the market's expectations of it but also on the Bank of England's monetary policy. The British central bank currently sees no grounds for further rate cuts, and inflation in the UK may accelerate in the coming months. This fact prevents the heavily overbought pound from dropping further. It is worth noting that even after a 370-pip drop, the British currency remains overbought and unjustifiably expensive. Therefore, we are only expecting a decline from it. Perhaps the market is waiting for a "wake-up call" from the BoE.
On Monday, despite the low volatility, two sell signals were generated. First, the pair consolidated below the 1.3119 level and then bounced off it from below. Later, during the European trading session, the price dropped to 1.3060, narrowly missing the target level of 1.3050. However, traders had ample time to close their short positions with profit.
COT Report:

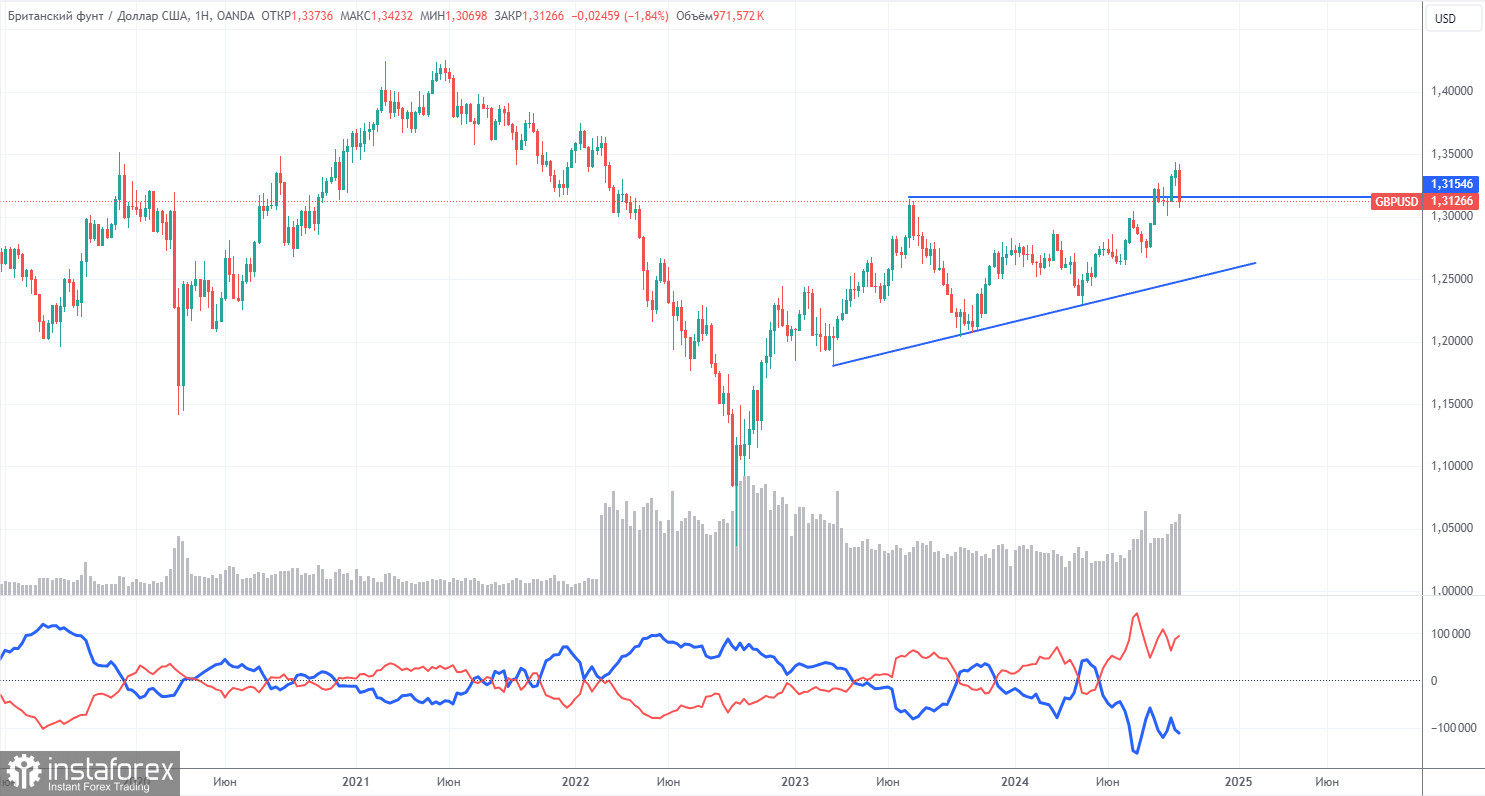
COT reports on the British pound show that in recent years, commercial traders' sentiment has been constantly changing. The red and blue lines, representing the net positions of commercial and non-commercial traders, frequently cross and are mainly near the zero mark. We also see that the last downward trend occurred when the red line was below zero. The red line is above zero, and the price has broken through the important level of 1.3154.
According to the latest report on the British pound, the non-commercial group opened 6,100 BUY contracts and closed 600 SELL contracts. As a result, the net position of non-commercial traders increased by 6,700 contracts over the week. The British pound continues to be bought up by market participants.
The fundamental backdrop still does not justify long-term purchases of the British pound, and the currency has real chances of resuming the global downward trend. However, on the weekly time frame, we have a formed ascending trendline, so until it is breached, a long-term decline in the pound is unlikely. The pound sterling is rising despite almost everything, and even when COT reports show that major players are selling the pound, it continues to rise.
Analysis of GBP/USD 1H

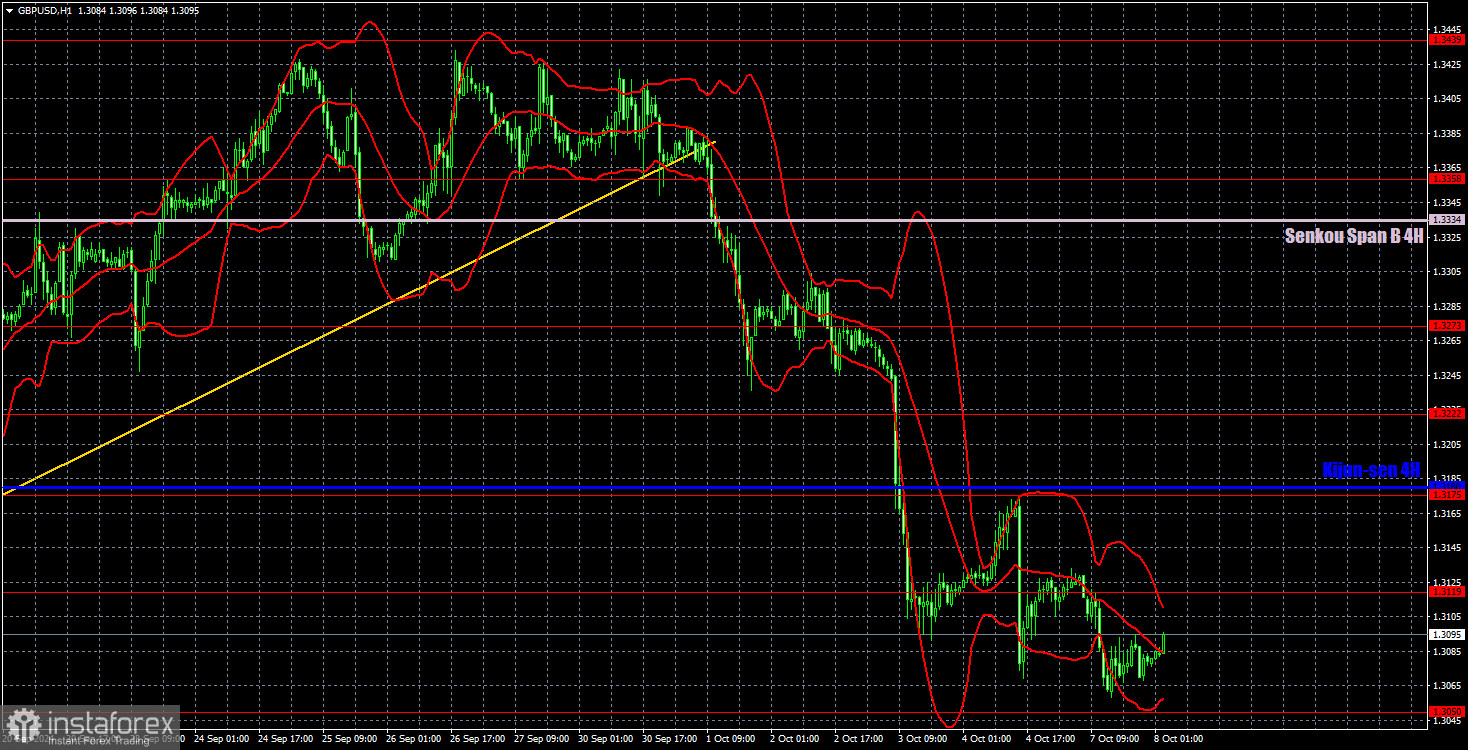
The GBP/USD pair continues to decline firmly in the hourly time frame. The upward trend has been canceled, and now only a solid and prolonged fall in the British currency is expected. Of course, the market may still resume baseless purchases of the British currency, but let us remind you once again—there are no fundamental or macroeconomic reasons for this. Thus, as before, we favor only downward movement, but the pair may correct upward during the current week.
For October 8, we highlight the following important levels: 1.2796-1.2816, 1.2863, 1.2981-1.2987, 1.3050, 1.3119, 1.3175, 1.3222, 1.3273, 1.3367, 1.3439. The Senkou Span B (1.3334) and Kijun-sen (1.3180) lines can also serve as signal sources. The Stop Loss level is recommended to be set to break even once the price moves 20 pips in the intended direction. The Ichimoku indicator lines may shift during the day, which should be considered when determining trading signals.
No crucial events or reports are scheduled for Tuesday in the UK or the US. Volatility may again be low, but overall, a correction is possible this week, at least until Thursday, when the US Consumer Price Index will be released.
Explanation of Illustrations:
Support and resistance levels: thick red lines where price movement may end. They are not sources of trading signals.
Kijun-sen and Senkou Span B lines: lines of the Ichimoku indicator transferred to the hourly time frame from the 4-hour chart. These are strong lines.
Extreme levels: thin red lines from which the price has previously bounced. They serve as sources of trading signals.
Yellow lines: trend lines, trend channels, and other technical patterns.
Indicator 1 on the COT charts: shows the net position size of each trader category.
 English
 Русский
 Bahasa Indonesia
 Bahasa Malay
 ไทย
ไทย Español
 Deutsch
 Български
 Français
 Tiếng Việt
 中文
中文 বাংলা
বাংলা हिन्दी
 Čeština
 Українська
 Română

