GBP/USD
Brief Analysis:
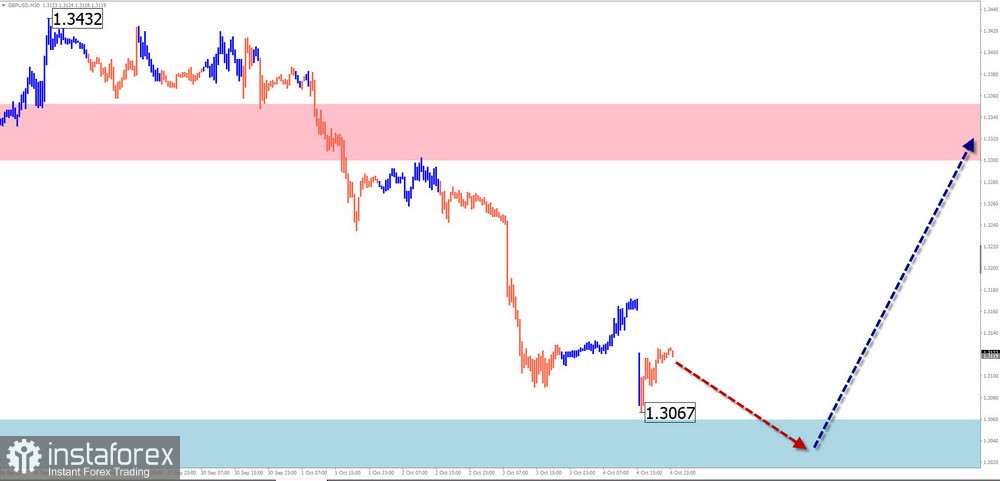
On the chart of the major British pound, the global trend over the last two years has been driving the pair's quotes upward. The wave structure is forming the final part (C). By the end of last month, the price reached the upper boundary of a strong potential reversal zone. A corrective phase has begun and remains incomplete.
Weekly Forecast:
At the beginning of the upcoming week, the British currency is expected to decline again toward the calculated support boundaries. A reversal may be anticipated thereafter. By the end of the week, an upward price movement is expected to begin. The resistance zone shows the upper limit of the pair's expected weekly range.
Potential Reversal Zones:
- Resistance: 1.3300/1.3350
- Support: 1.3060/1.3010
Recommendations:
- Sell Orders: Can be used during individual sessions with a reduced volume size. The downward potential is limited by the support zone.
- Buy Orders: Will be relevant once confirmed signals appear near the support zone in your trading systems.
AUD/USD
Brief Analysis:
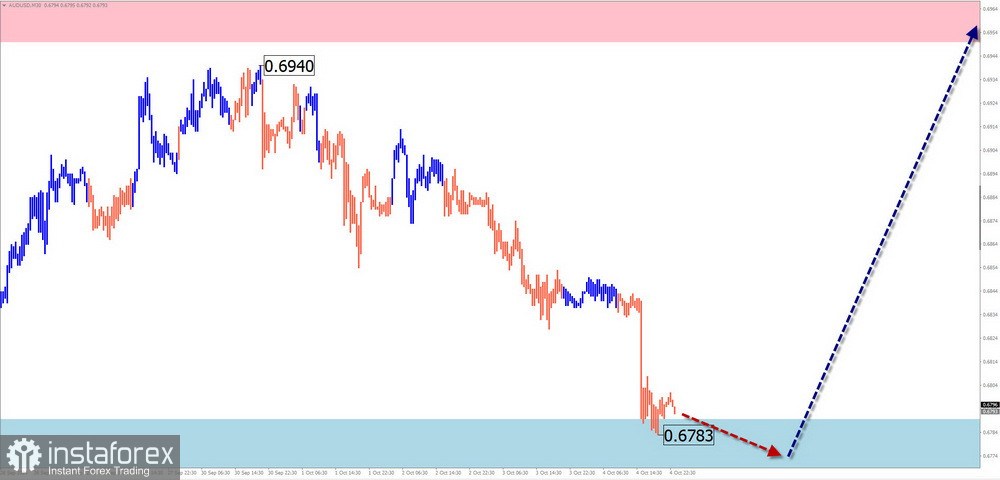
On the Australian dollar market, within the dominant upward trend, a counter-correction is developing. The unfinished segment started on September 30. From the upper boundary of the potential reversal zone on the larger timeframe, the price is forming the completion of a hidden correction. The wave structure is nearing completion, but no signs of an imminent reversal are visible.
Weekly Forecast:
During the upcoming week, the "Aussie" is expected to continue moving within the channel between the nearest opposing zones. After likely pressure on the support zone at the start of the week, a reversal and rise to the resistance zone can be expected. A brief breach of the lower boundary of the zone cannot be ruled out if the direction changes.
Potential Reversal Zones:
- Resistance: 0.6950/0.7000
- Support: 0.6790/0.6740
Recommendations:
- Buy Orders: Can be considered after confirmed signals appear near the support zone.
- Sell Orders: Lack potential and are risky for deposits.
USD/CHF
Brief Analysis:
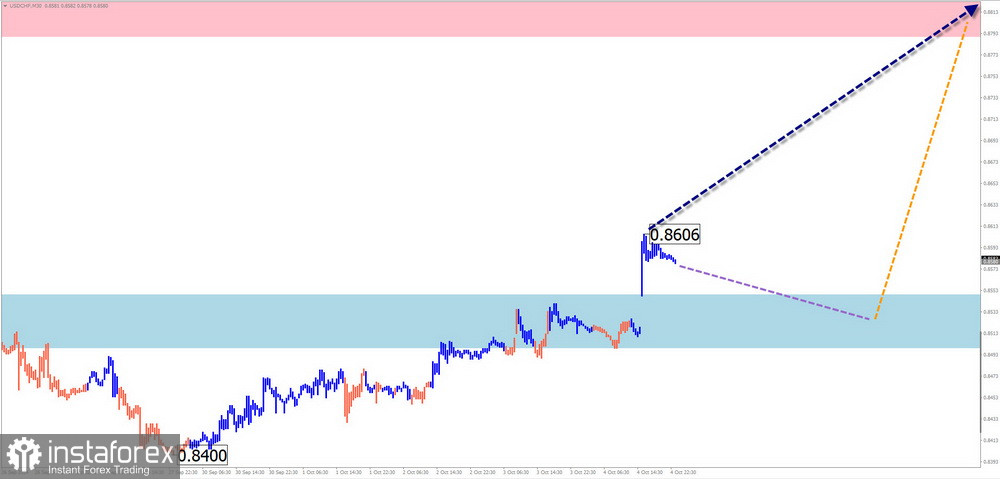
On the chart of the major Swiss franc pair, the upward wave that started in early August continues to dominate. The price has been moving mostly along the boundaries of the reversal zone on the monthly scale. At the end of last week, the zone was broken upward. The wave structure still shows no signs of completion.
Weekly Forecast:
In the coming days, the pair's price is expected to move mostly sideways. A rollback to the support area is possible. There is a high probability of a resumption of the price rise thereafter. A brief breach of the lower boundary of the support zone is not excluded if the trend changes.
Potential Reversal Zones:
- Resistance: 0.8790/0.8840
- Support: 0.8550/0.8500
Recommendations:
- Sell Orders: Due to limited potential, the risk of deposit loss is high.
- Buy Orders: Can be considered with a reduced volume size after confirmed signals appear near the support zone in your trading systems.
EUR/JPY
Brief Analysis:
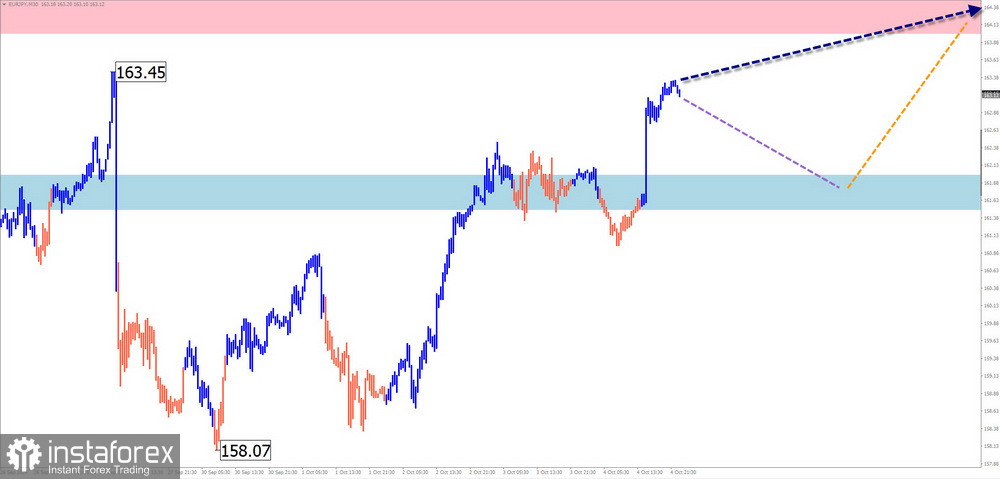
The current upward wave structure on the euro/yen chart started on August 5. Over the past three weeks, the final part (C) of the structure has been developing. As of the time of analysis, the wave is incomplete. The price has reached the boundaries of the potential reversal zone on the weekly timeframe.
Weekly Forecast:
At the beginning of the upcoming week, the pair's price is expected to move sideways with a downward vector. A decline toward the support zone can be expected. By the end of the week, a reversal and resumption of the price rise are likely.
Potential Reversal Zones:
- Resistance: 164.00/164.50
- Support: 162.00/161.50
Recommendations:
- Sell Orders: Possible in intraday trading with a reduced volume size. The potential of such trades is limited by the support zone.
- Buy Orders: Can be recommended as the main trading direction after confirmed reversal signals appear near the support zone.
EUR/GBP
Analysis:
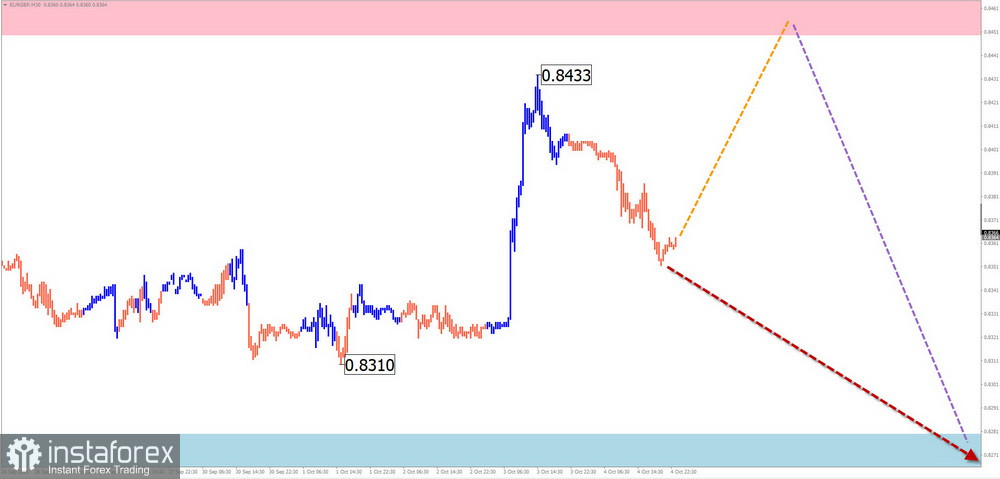
Analysis of the weekly chart of the euro/British pound pair shows the formation of a downward horizontal plane. The movement segment starting from August 5 marked the beginning of the final part of the main trend. Over the past ten days, the price has been drifting sideways along the resistance zone. The price needs to consolidate above the next broken level.
Forecast:
A flat movement is likely in the coming days of the upcoming week. Temporary pressure on the resistance zone is not excluded. After that, a reversal and resumption of the downward trend toward the calculated support boundaries can be expected.
Potential Reversal Zones:
- Resistance: 0.8450/0.8500
- Support: 0.8280/0.8230
Recommendations:
- Sell Orders: May be risky. It is safer to reduce the volume size in trades.
- Buy Orders: Can become the main trading direction after confirmed signals appear near the support zone in your trading systems.
Ethereum
Analysis:
An upward wave has been developing in the Ethereum market since August of this year. Its potential exceeds the retracement level of the previous trending section. The unfinished downward wave segment has been active since September 27. The price is trapped in a narrow price channel between two opposing zones.
Forecast:
At the start of the upcoming week, an upward movement vector is expected. In the area of calculated resistance, a halt and the formation of reversal conditions can be expected. By the end of the week, volatility may increase, and a resumption of the Ethereum price decline is likely.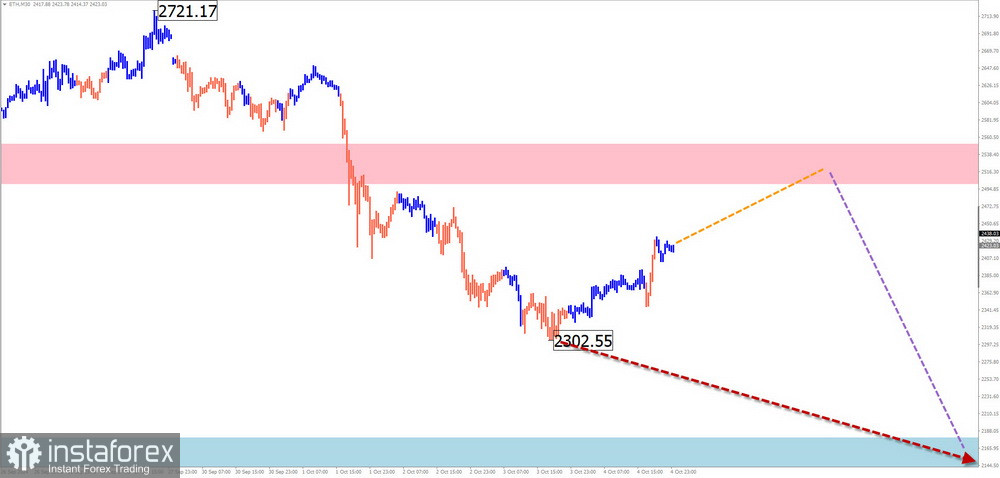
Potential Reversal Zones:
- Resistance: 2500.0/2550.0
- Support: 2180.0/2130.0
Recommendations:
- Buy Orders: Before the current decline ends, buying is quite risky and may lead to deposit losses.
- Sell Orders: Possible with a reduced volume size after signals from your trading systems appear near the resistance zone.
US Dollar Index
Brief Analysis:
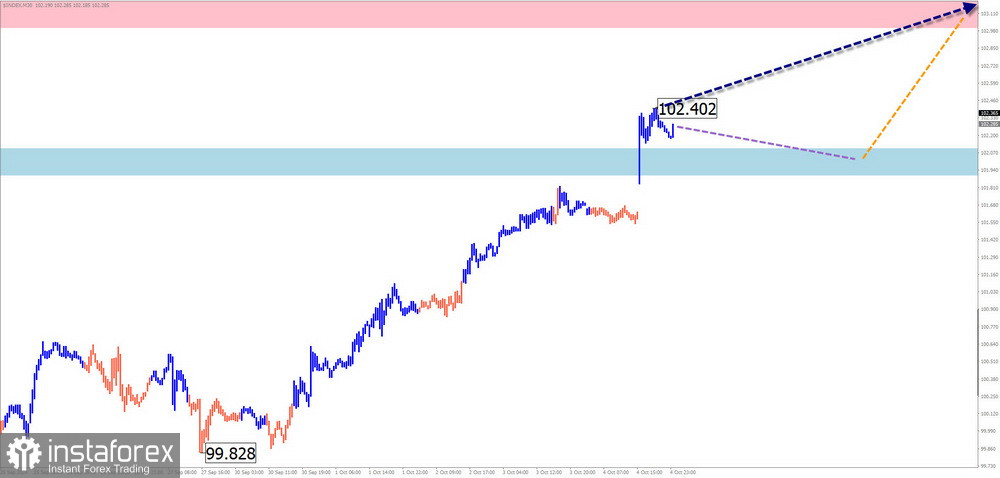
The short-term bullish trend of the U.S. dollar, which began at the end of last month, continues. Quotes have broken through the level of intermediate resistance. As of the time of analysis, the wave structure shows no signs of completion. Before continuing the rise, the index quotes need to undergo correction.
Weekly Forecast:
In the first half of the upcoming week, a sideways movement of the index is most likely. A downward vector with a decline is expected, but not below the support zone. Afterwards, the dollar's rise may resume.
Potential Reversal Zones:
- Resistance: 103.00/103.20
- Support: 102.10/101.90
Recommendations:
The rise in the dollar's value is expected to continue in the coming weeks. Attempting to bet on major currencies' growth may lead to deposit losses. It is optimal to remain in short positions on the major currency pairs until dollar index reversal signals appear.
Explanations: In simplified wave analysis (SWA), all waves consist of three parts (A-B-C). The last, incomplete wave is analyzed on each timeframe. Dashed lines indicate the expected movements.
Note: The wave algorithm does not account for the duration of the instrument's movements over time!
 English
 Русский
 Bahasa Indonesia
 Bahasa Malay
 ไทย
ไทย Español
 Deutsch
 Български
 Français
 Tiếng Việt
 中文
中文 বাংলা
বাংলা हिन्दी
 Čeština
 Українська
 Română

