EUR/USD

Higher time frames
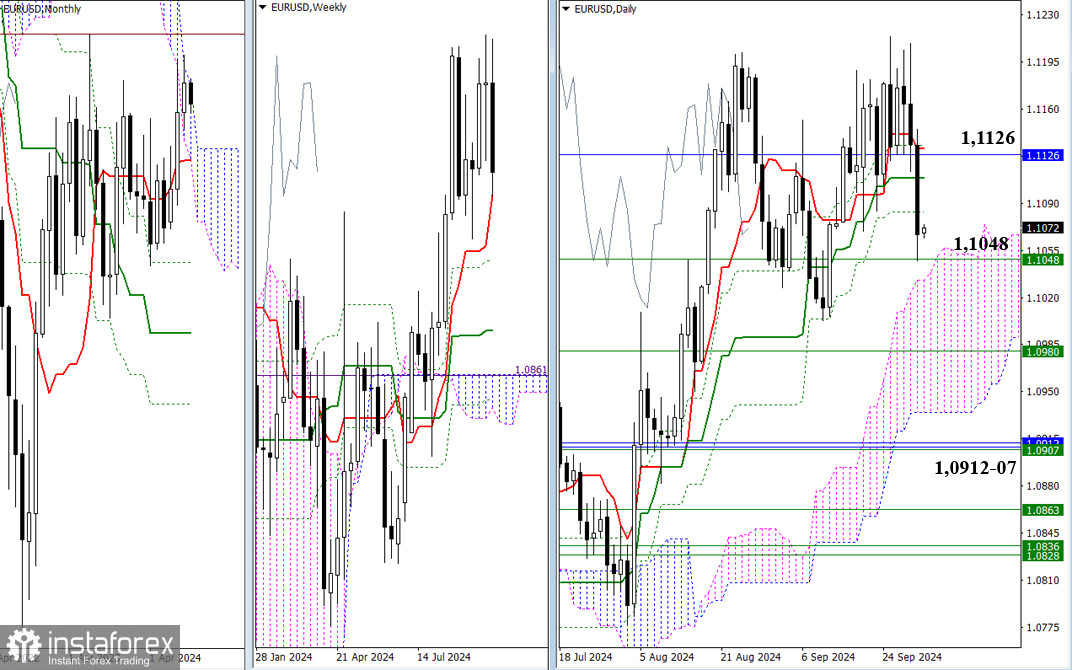
The bears wasted no time and decided to start the month with active and effective downward movement. As of yesterday, the support of the weekly short-term trend (1.1048) was tested. A pause is currently possible. If the bulls try to regain at least part of their positions now, we can expect a retest of the levels passed the day before (1.1084 – 1.1109 – 1.1126-30). If the encountered support (1.1048) is broken, the continuation of the bearish attack will move through the daily cloud (1.1038 – 1.0935), where additional support may come from the weekly level (1.0980). The most reinforced and significant support area in this section of the chart is slightly lower at 1.0912 – 1.0907 (lower boundary of the monthly cloud + monthly short-term trend + weekly medium-term trend).

H4 – H1
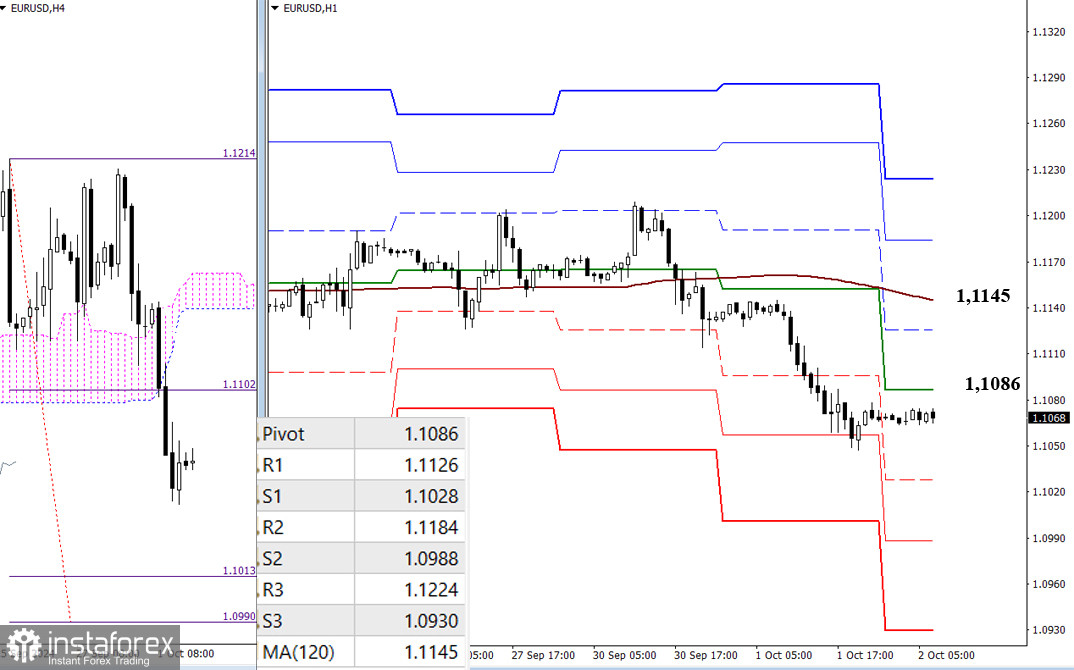
The bears currently have the main advantage in the lower time frames. They have broken through the H4 cloud and formed a target, so today's bearish targets during the day can be the support levels of the classic Pivot Points (1.1028 – 1.0988 – 1.0930) and the target for breaking through the H4 cloud (1.1013 – 1.0990). The market will face the key levels in the case of an upward correction at 1.1086 (central Pivot Point of the day) and 1.1145 (weekly long-term trend). A breakdown and trend reversal could change the current balance of power. Aside from the key levels, today's bullish references during the day can be noted at 1.1126 – 1.1184 – 1.1224 (resistance levels of the classic Pivot Points).
***
GBP/USD

Higher time frames
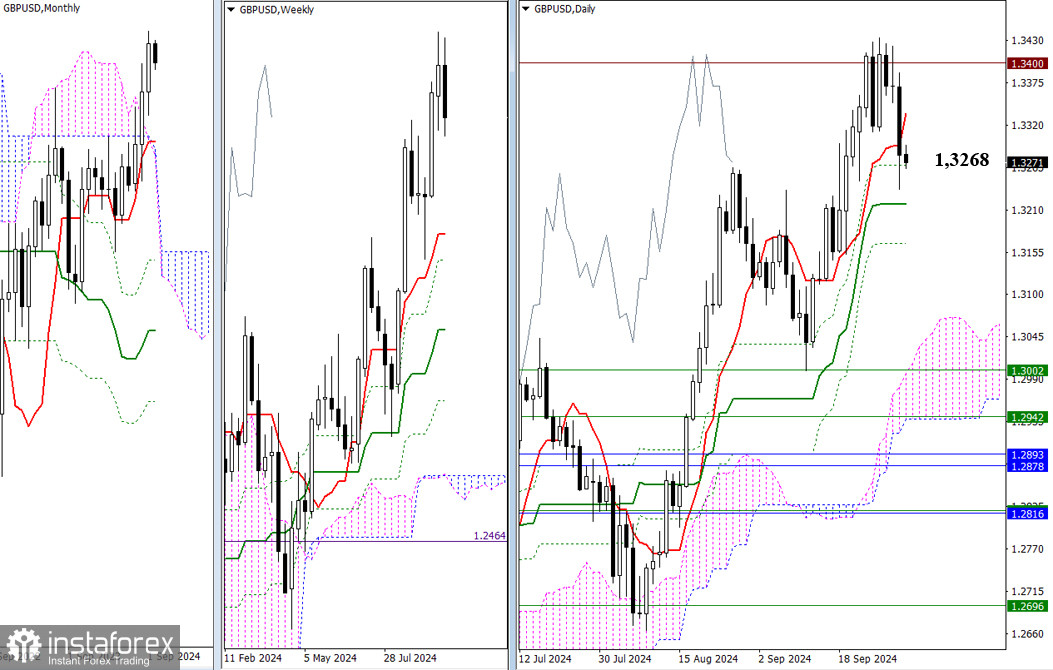
With the start of the new month, the bears have taken the initiative, deciding to leave the consolidation zone below the psychological resistance level (1.3400) and test the strength of the Ichimoku daily golden cross's supports. The market has passed the daily short-term trend (1.3335), and now the support at 1.3268 is being tested. After that, the bears will face the final levels of the Ichimoku daily golden cross (1.3217 – 1.3166).

H4 – H1
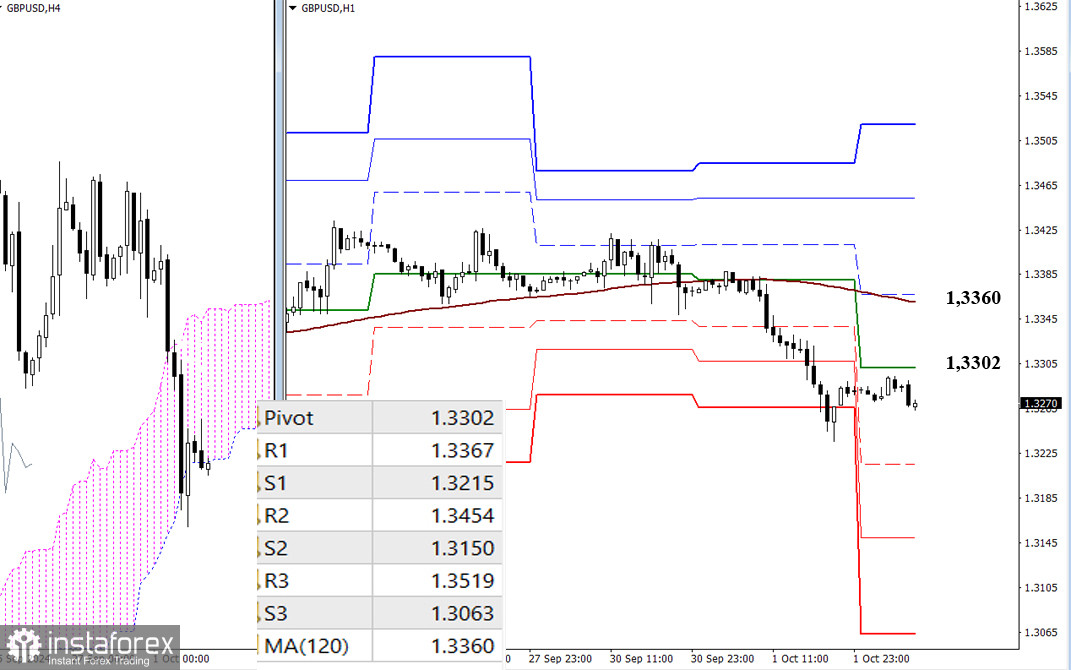
In the lower time frames, the bears have moved below the weekly long-term trend (1.3360) and, with the depth of the decline, have managed to turn the trend in their favor. If this sentiment persists, the decline could continue, with targets currently at 1.3215, 1.3150, and 1.3063 (supports of the classic Pivot Points). If the bulls manage to regain their positions, the market will first encounter key levels located today at 1.3302 (the central Pivot Point of the day) and 1.3360 (weekly long-term trend), with additional targets at 1.3367, 1.3454, and 1.3519 (resistances of the classic Pivot Points) becoming relevant only after breaking the trend.
***
In the technical analysis of the situation, the following tools were used:
- Higher time frames: Ichimoku Kinko Hyo (9.26.52) + Fibo Kijun levels
- Lower time frames: H1 – Pivot Points (classical) + Moving Average 120 (weekly long-term trend)
 English
 Русский
 Bahasa Indonesia
 Bahasa Malay
 ไทย
ไทย Español
 Deutsch
 Български
 Français
 Tiếng Việt
 中文
中文 বাংলা
বাংলা हिन्दी
 Čeština
 Українська
 Română

