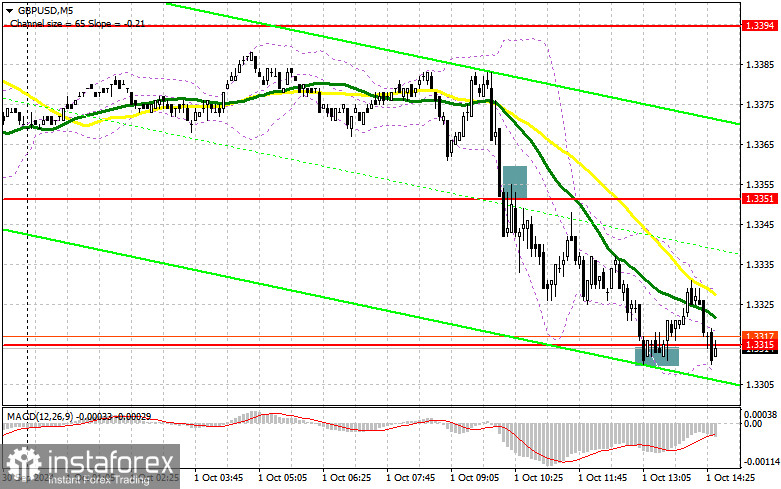
In my morning forecast, I focused on the 1.3351 level and planned to make market entry decisions based on it. Let's take a look at the 5-minute chart and analyze what happened. A breakout and retest of this level created a suitable condition for selling the pound, leading to a decline of more than 35 points in the pair. Buying on a false breakout from 1.3315 only resulted in about 10 points of profit before the pair faced renewed pressure. The technical picture was revised for the second half of the day.

To Open Long Positions on GBP/USD:
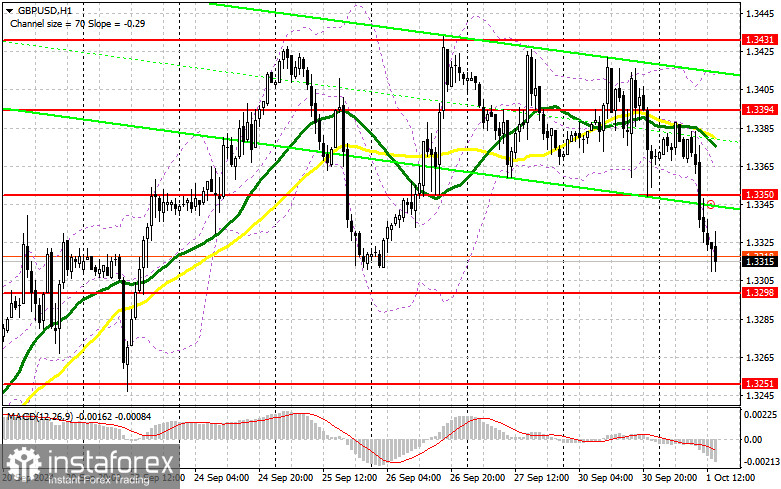
Mediocre data on manufacturing activity in the UK failed to inspire pound buyers, triggering another wave of selling, which began after Powell's comments yesterday. In the second half of the day, the ISM Manufacturing Index figures for September may strengthen the dollar's position, especially if the report exceeds economists' forecasts. We also anticipate job openings and labor turnover data from the Bureau of Labor Statistics, followed by speeches from FOMC members Raphael Bostic and Lisa D. Cook, which could lead to a prolonged sell-off in the pound. Therefore, I plan to act if the price declines toward the new support at 1.3298. A false breakout formation there will provide a chance for a slight rise, aiming for a recovery toward the 1.3350 resistance formed earlier today. A breakout and retest from top to bottom of this range will strengthen the chances for an upward trend, potentially triggering stop-loss orders for sellers and providing a suitable entry point for long positions, with a target of 1.3394, where the moving averages are located. The furthest target will be 1.3431, where I plan to take profits. If GBP/USD continues to decline and there's no bullish activity around 1.3298 in the second half of the day, the pressure on the pair will intensify, leading to a fall and a test of the 1.3251 support. Only a false breakout there would justify opening long positions. I will consider buying GBP/USD immediately if it rebounds from the 1.3220 low, aiming for a 30-35 point intraday correction.
To Open Short Positions on GBP/USD:
Sellers are acting aggressively, and their immediate task is to defend the resistance at 1.3350. A test of this level following the release of U.S. statistics, combined with a false breakout, will offer a suitable entry point for selling the pound, targeting a further decline toward the 1.3298 support, the previous week's low. A breakout and retest from bottom to top of this range will undermine buyer positions, leading to stop-loss triggers and opening the way to 1.3251. The furthest target will be around 1.3220, where I plan to take profits. If GBP/USD rises and there's no bearish activity around 1.3350 in the second half of the day, which is possible given the current bullish trend, buyers will continue pushing the pound higher. Bears will then likely retreat to the 1.3394 resistance, below which the moving averages support sellers. I'll only consider selling on a false breakout there. If there's no downward movement, I'll look for short positions on a rebound around 1.3431, expecting a 30-35 point downward correction.

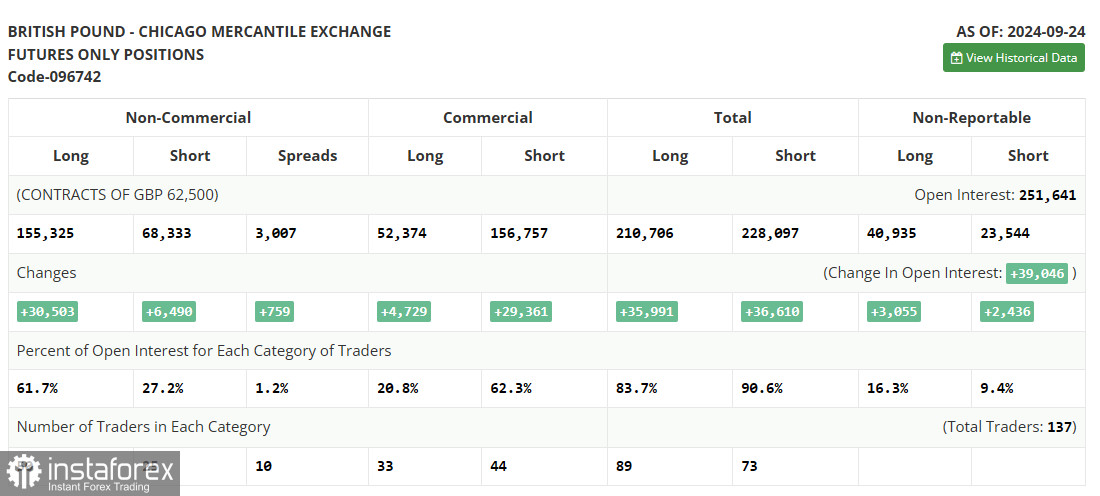
The COT (Commitment of Traders) report for September 24 showed an increase in both short and long positions. It's evident that following the Bank of England's decision to maintain monetary policy and the Federal Reserve's rate cut, pound buyers are growing in number daily. The likelihood that the U.S. Federal Reserve will maintain a dovish stance encourages the purchase of risk assets, moving away from the U.S. dollar. Statements from Bank of England representatives regarding the strength of the economy also attract new traders betting on the medium-term strengthening of the pound. The latest COT report indicated that long non-commercial positions increased by 30,503 to 155,325, while short non-commercial positions grew by 6,490 to 68,333. As a result, the spread between long and short positions increased by 759.
Indicator Signals:
Moving Averages
Trading is conducted below the 30 and 50-period moving averages on the H1 hourly chart, indicating a decline in the pound.
Note: The moving average periods and prices are considered by the author on the H1 hourly chart and differ from the general definition of classic daily moving averages on the D1 daily chart.
Bollinger Bands
In the case of a decline, the lower boundary of the indicator around 1.3320 will act as support.
Indicator Descriptions:
- Moving average: Defines the current trend by smoothing volatility and noise. Period 50, marked in yellow on the chart.
- Moving average: Defines the current trend by smoothing volatility and noise. Period 30, marked in green on the chart.
- MACD Indicator: (Moving Average Convergence/Divergence) Tracks the convergence/divergence of moving averages. Fast EMA period 12, Slow EMA period 26, SMA period 9.
- Bollinger Bands: Period 20.
- Non-commercial traders: Speculators such as individual traders, hedge funds, and large institutions using the futures market for speculative purposes.
- Long non-commercial positions: Represents the total long open positions of non-commercial traders.
- Short non-commercial positions: Represents the total short open positions of non-commercial traders.
- Total non-commercial net position: The difference between short and long positions of non-commercial traders.
 English
 Русский
 Bahasa Indonesia
 Bahasa Malay
 ไทย
ไทย Español
 Deutsch
 Български
 Français
 Tiếng Việt
 中文
中文 বাংলা
বাংলা हिन्दी
 Čeština
 Українська
 Română

