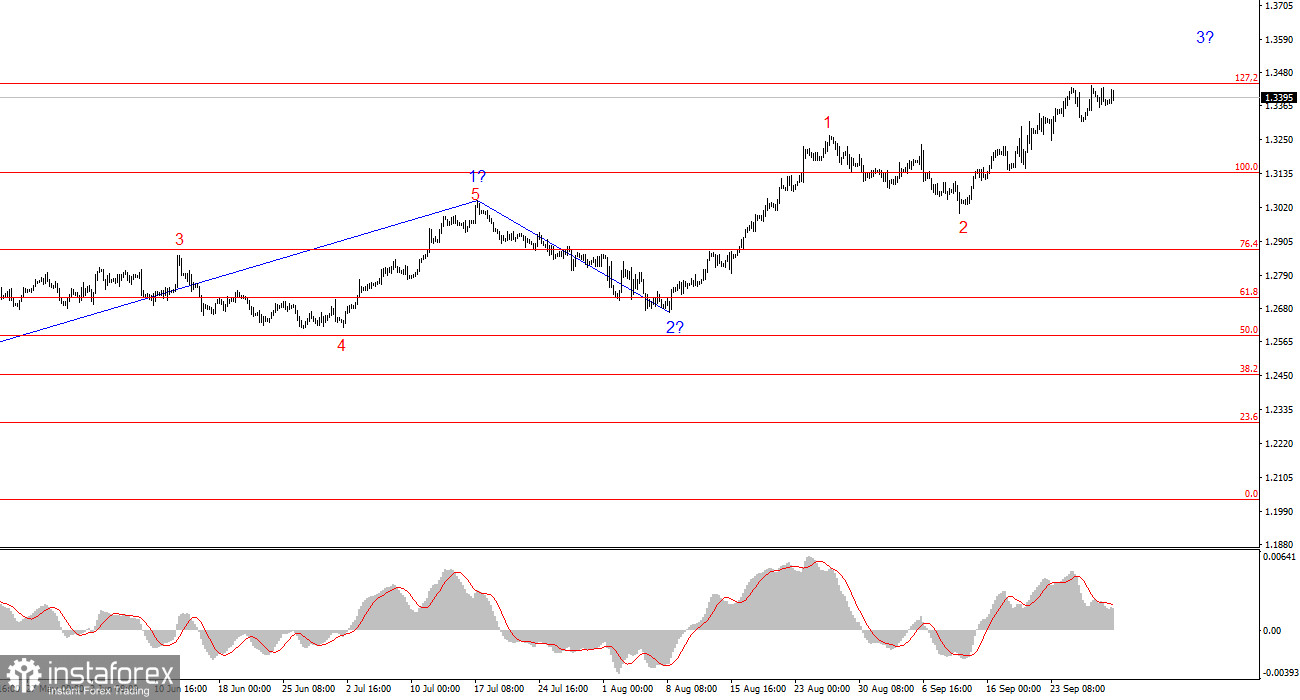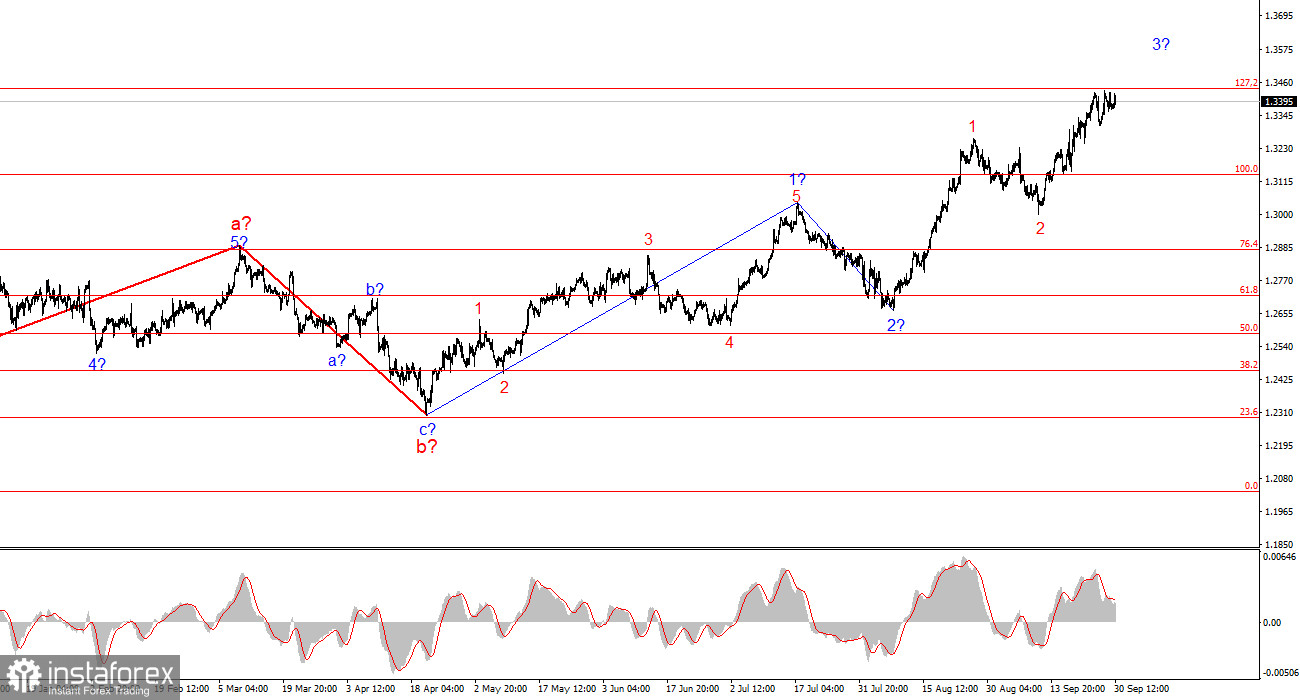
The wave structure of the GBP/USD pair remains complex and is evolving into an increasingly prolonged pattern. Initially, the wave structure seemed convincing and suggested the formation of a downward series of waves targeting levels below 1.2300. However, in practice, demand for the British pound continues to grow, disrupting potential wave formations. The market persistently increases long positions.
At present, it appears that the upward segment of the trend, which began on April 22, has become significantly more complicated. If this assumption is correct, we have already observed waves 1 and 2 within wave c. Consequently, the construction of the third upward wave in c likely began on August 8, and this wave is developing into an extended five-wave structure. Therefore, the British pound could potentially rise to the 1.4000 level, representing just the third wave in the projected c. A fifth wave might follow, which could also form a complete five-wave structure.
The U.S. dollar continues to weaken.
The GBP/USD pair rose by 20 basis points on Monday, and overall, demand for the U.S. dollar is steadily declining. Although the pound failed to break last week's highs today, it seems that this could happen very soon. The market demonstrated on Monday the direction it is prepared to take.
The only notable report today was the UK's Q2 GDP data, which revealed that the British economy's growth rate was lower than both previous estimates and market expectations. The economy expanded by just 0.5% on a quarterly basis and 0.7% on an annual basis, compared to the anticipated growth of 0.7% quarter-on-quarter and 0.9% year-on-year. Consequently, this report fell short of market expectations.
However, the market didn't react negatively and instead ignored the report, as it didn't fit the prevailing narrative. Demand for the pound began rising steadily from the morning. By the end of the day (especially during the US session), the dollar might recover, but the fact that the market is buying the pound despite weak UK data is highly indicative of current market sentiment.
This week, key data will be released from the U.S., and it's expected that market participants will pay close attention to the most negative reports while potentially ignoring positive ones. Under these conditions, the U.S. dollar may face significant challenges. On shorter-term charts, it's evident that the price is approaching the 1.3440 level, and this level could be breached as early as tomorrow. According to the current wave structure, demand for the pound is expected to rise for an extended period.
Overall Conclusions
The wave structure of the GBP/USD pair continues to become more complex. If the upward trend began on April 22, it is likely to develop over a considerable period. I still consider selling opportunities more attractive, but they require clear signals. At the moment, there is little doubt that a new upward wave has begun and is ongoing. The nearest target for this wave is the 1.3440 level, which corresponds to 127.2% on the Fibonacci scale. A successful breakout of this level might propel the market toward the 1.3800 level.
On a higher wave scale, the wave pattern has evolved. We can now assume the formation of a complex and extended corrective upward wave structure. Currently, this appears to be a three-wave pattern, but it could develop into a five-wave structure, which may take several more months to complete.
Key Principles of My Analysis:
- Wave structures should be simple and understandable. Complex structures are challenging to trade and frequently change.
- If you're not confident about the market situation, it's best to stay out.
- There is never 100% certainty in the direction of movement. Always remember to use Stop Loss orders for protection.
- Wave analysis can be combined with other types of analysis and trading strategies.
 English
 Русский
 Bahasa Indonesia
 Bahasa Malay
 ไทย
ไทย Español
 Deutsch
 Български
 Français
 Tiếng Việt
 中文
中文 বাংলা
বাংলা हिन्दी
 Čeština
 Українська
 Română

