EUR/USD
Brief Analysis:
The upward trend has defined the euro's movement since April this year. From the lower boundary of a significant potential reversal zone, the price continues its sideways movement that began about a month and a half ago. Analysis of the structure shows that the correction is still incomplete, and the price is approaching the upper boundary of the sideways range.
Weekly Forecast:
Over the next couple of days, the euro is expected to continue moving sideways along the resistance zone. Subsequently, conditions may form for a reversal and the beginning of a price decline. The pair's downward movement could continue to the calculated support levels, while a breakout above within the weekly period is unlikely.
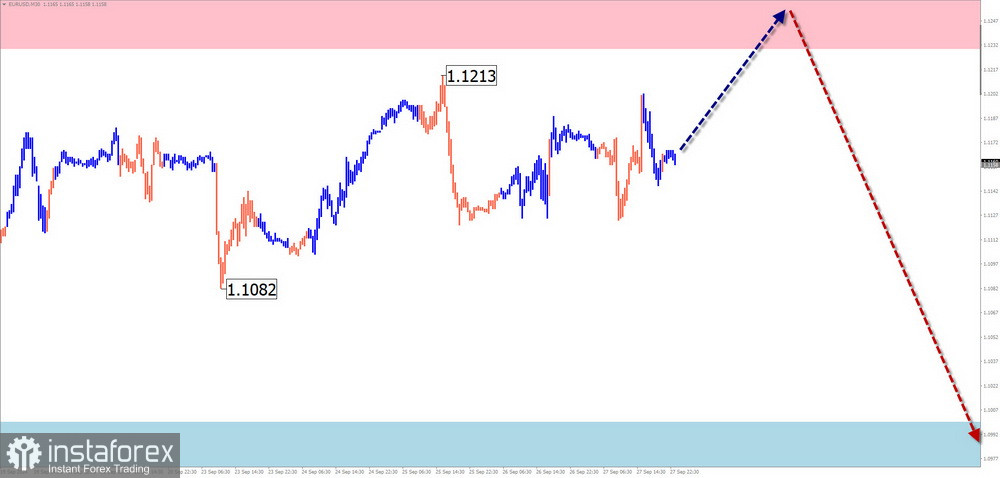
Potential Reversal Zone
- Resistance: 1.1230/1.1280
- Support: 1.1000/1.0500
Recommendations:
- Sell: Consider selling with reduced volume sizes during individual sessions after confirmed signals.
- Buy: Risky; could lead to losses in the coming days.
USD/JPY
Brief Analysis:
An upward trend has been developing in the Japanese yen chart since August. This trend has a shifting plane and reversal potential. Currently, the corrective part (B) is nearing completion. Before an active rise, the price is moving toward the preliminary target zone.
Weekly Forecast:
In the coming days, the most likely scenario is a downward movement toward the calculated support boundaries. After the weekend, increased volatility is expected, followed by a reversal and the beginning of active growth. The release of important economic data may serve as a temporary guide.
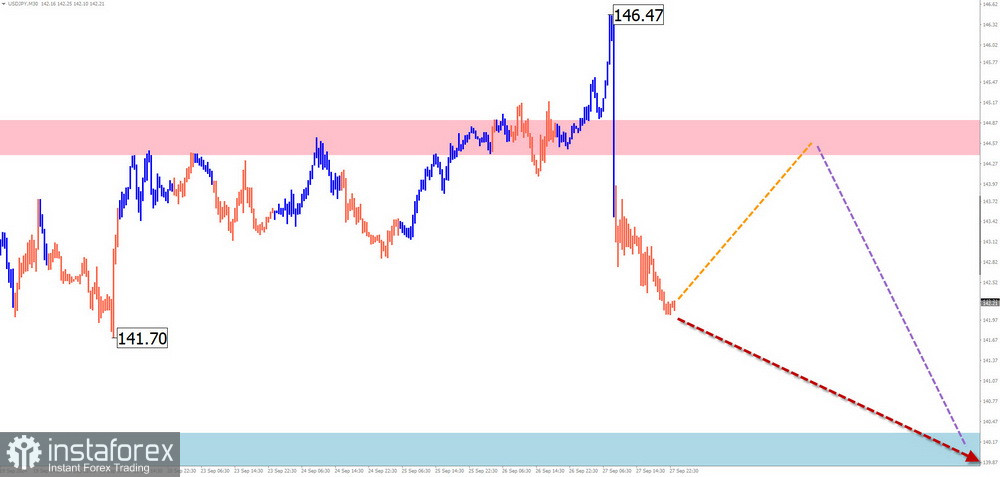
Potential Reversal Zone
- Resistance: 144.40/144.90
- Support: 140.30/139.80
Recommendations:
- Sell: Limited potential. It's safer to reduce the volume size.
- Buy: Could become the primary trading direction after reversal signals are confirmed near the support zone in your trading system (TS).
GBP/JPY
Brief Analysis:
A new upward trend began in the GBP/JPY pair in August. On a larger scale, this segment forms the beginning of another wave in the dominant uptrend. Since the end of last week, an intermediate correction in the final part (C) has been developing, and its completion will signal the start of a new short-term upward trend.
Weekly Forecast:
In the coming days, expect predominantly sideways price movement along the support zone levels. By the end of the week, the sideways trend should conclude, followed by a reversal and active growth. Increased volatility may coincide with the release of important news blocks.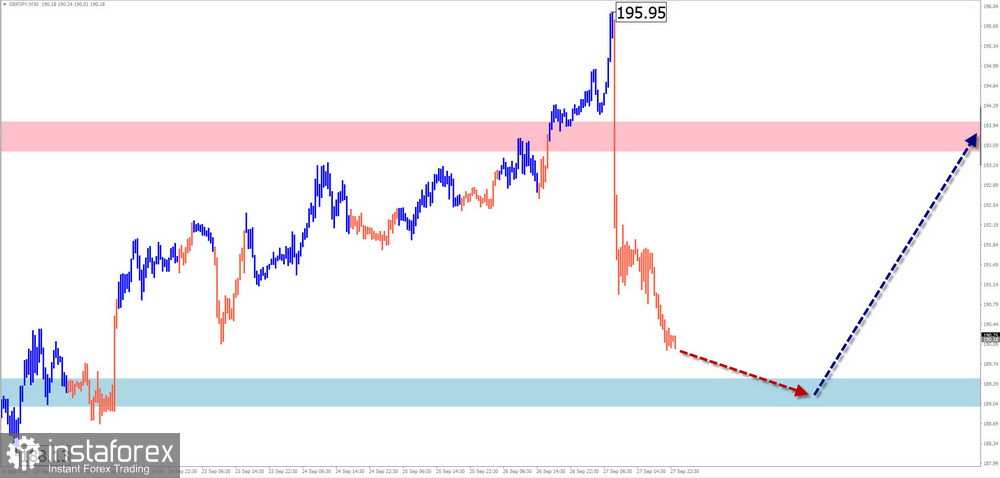
Potential Reversal Zone
- Resistance: 193.50/184.50
- Support: 189.50/189.00
Recommendations:
- Sell: Low potential; may lead to losses.
- Buy: Will become relevant after confirmed signals in the support zone appear.
USD/CAD
Brief Analysis:
The current wave structure on the Canadian dollar chart has been upward since mid-July of this year. In recent months, a corrective part (B) has been forming in the shape of an extended flat. The structure of this wave appears to be complete, and the potential of the bullish segment that began on September 25 exceeds the retracement level.
Weekly Forecast:
Expect predominantly sideways movement in the coming days, with a likely downward vector. The price may move downward to the lower support boundary, followed by a potential reversal and resumption of the pair's upward course in the second half of the week. The calculated resistance shows the most anticipated end point of the entire wave.
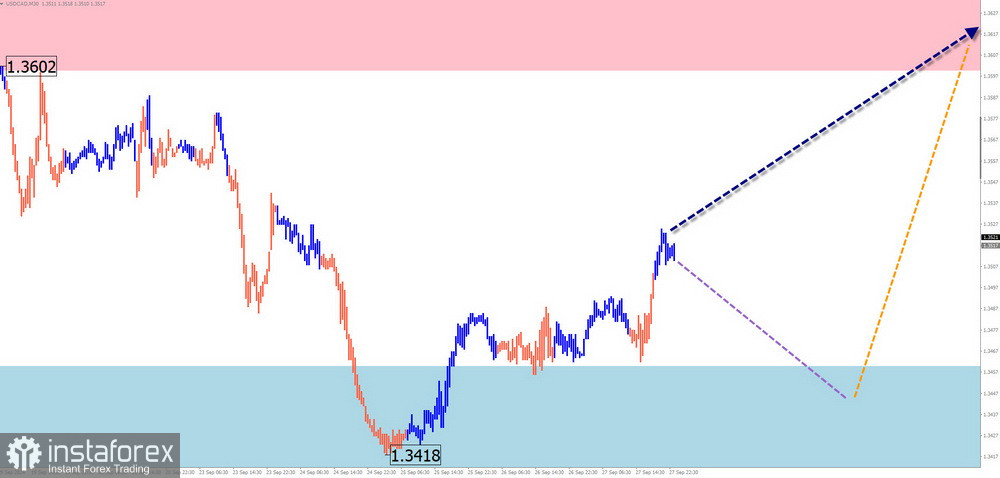
Potential Reversal Zone
- Resistance: 1.3600/1.3650
- Support: 1.3460/1.3410
Recommendations:
- Sell: Can be used with smaller volume sizes during individual sessions, but potential is limited by the support.
- Buy: Will become relevant after confirmed reversal signals near the support zone.
NZD/USD
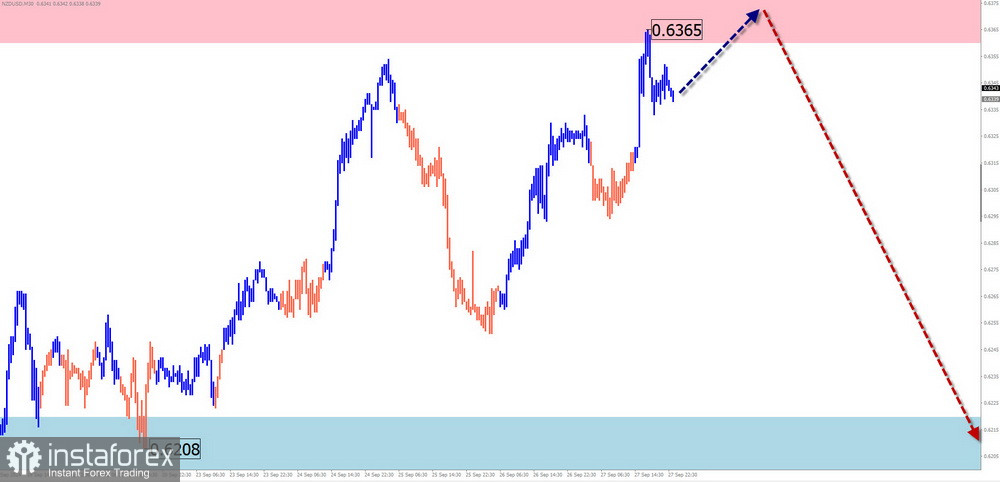
For the past two months, the NZD/USD pair has been moving in an upward direction. Last week, the price reached the lower boundary of a strong potential reversal zone. In recent days, the price has moved predominantly sideways along the strong support, forming the beginning of the corrective part (B).
Weekly Forecast:
In the next few days, the sideways movement may continue, with temporary pressure on the upper resistance zone boundary. A reversal and a price decline are then expected.
Potential Reversal Zone
- Resistance: 0.6360/0.6410
- Support: 0.6220/0.6170
Recommendations:
- Buy: Low potential, risky.
- Sell: After confirmed reversal signals appear in the resistance zone, selling could become the main trading direction.
EUR/GBP
Brief Analysis:
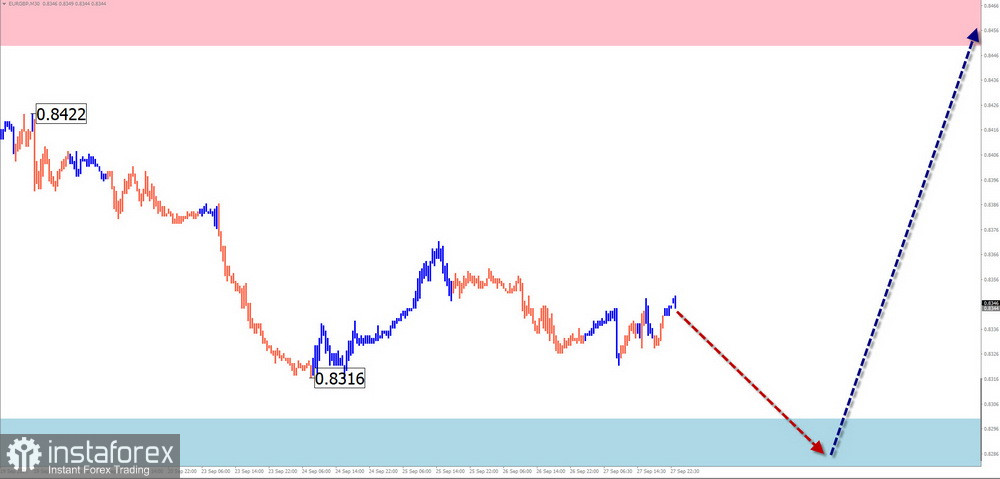
Since autumn of the year before last, the EUR/GBP pair has been forming a downward trend. A hidden correction (B) has just completed, and the first part of the final segment (C) is nearing completion. The price is near the upper boundary of the potential reversal zone on the daily timeframe (TF).
Weekly Forecast:
Expect the downward trend to continue in the first days of the upcoming week. As the weekend approaches, there's a high probability of a direction change with an upward move. This change may be accompanied by a sharp spike in volatility.
Potential Reversal Zone
- Resistance: 0.8450/0.8500
- Support: 0.8300/0.8250
Recommendations:
- Sell: Limited potential; may be unprofitable.
- Buy: Signals from your trading systems will become relevant after confirmed reversal signals appear in the support zone.
Gold
Analysis:
Gold prices are reaching historical records. Over the past two weeks, the price has been within a strong potential reversal zone on the weekly TF. Since last week, gold has been drifting sideways, forming the completion of a hidden extended corrective flat.
Forecast:
At the start of the week, expect a sideways movement along the resistance zone. Increased activity and a change in direction may occur closer to the weekend, potentially coinciding with the release of economic news.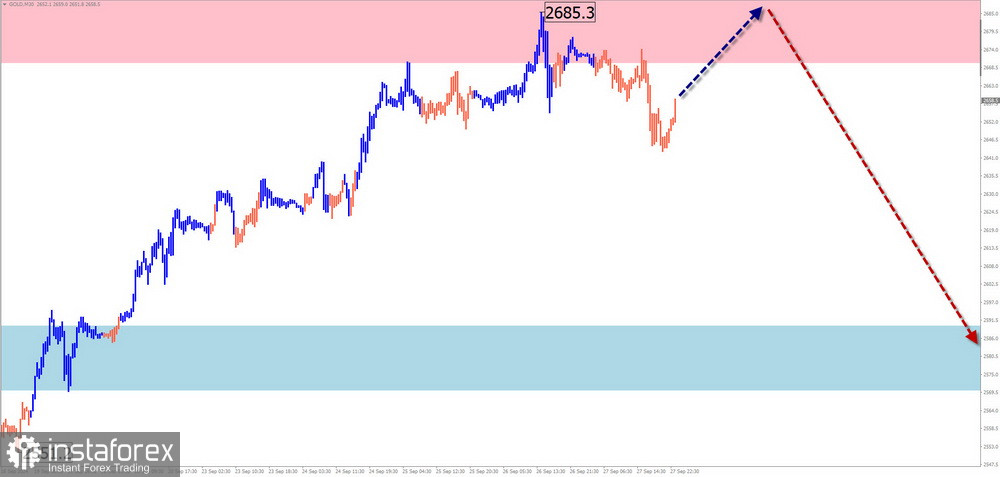
Potential Reversal Zone
- Resistance: 2670.0/2690.0
- Support: 2590.0/2570.0
Recommendations:
- Buy: Low potential, may lead to losses.
- Sell: Consider trading after reversal signals appear around the resistance zone in your trading systems (TS).
Notes: In simplified wave analysis (SWA), all waves consist of 3 parts (A-B-C). The analysis focuses on the latest unfinished wave in each TF. Dashed lines indicate expected movements.
Attention: The wave algorithm does not consider the duration of price movements over time.
 English
 Русский
 Bahasa Indonesia
 Bahasa Malay
 ไทย
ไทย Español
 Deutsch
 Български
 Français
 Tiếng Việt
 中文
中文 বাংলা
বাংলা हिन्दी
 Čeština
 Українська
 Română

