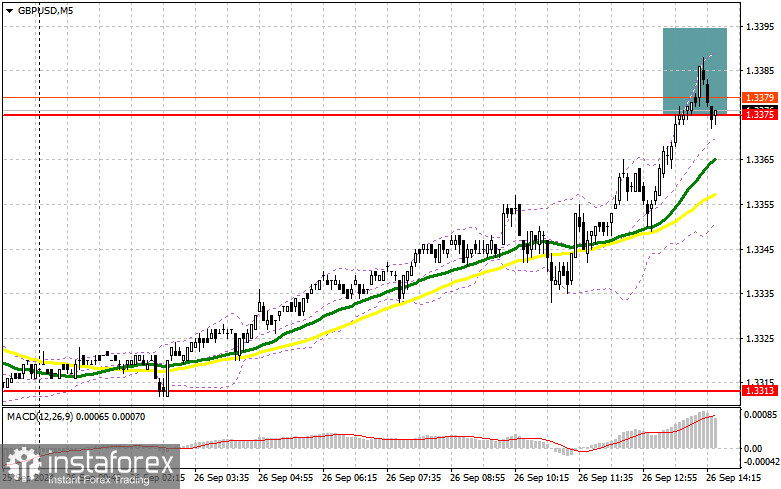
In my morning forecast, I focused on the 1.3375 level and planned to base my market entry decisions on it. Let's examine the 5-minute chart to analyze what occurred. The rise and formation of a false breakout around 1.3375 provided an excellent entry point for selling the pound; however, the pair did not drop as expected. The technical picture was slightly revised for the second half of the day.

Requirements for Opening Long Positions on GBP/USD:
The absence of UK statistics forced pound sellers to stay on the sidelines. Now, it's crucial to observe the U.S. GDP data for the second quarter, along with the weekly number of initial jobless claims. If the data disappoints, the pound might rise even further. Additional pressure on the dollar could come from the speech by Federal Reserve Chair Jerome Powell, as it's unlikely his speech will contain any hawkish signals.
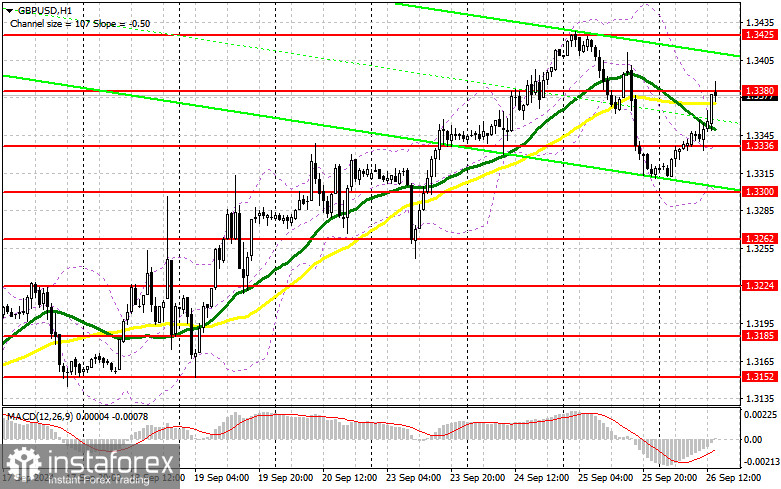
If GBP/USD declines following U.S. data, confirming the morning sell signal, I would prefer to return to long positions only after the 1.3336 support level, which was formed in the first half of the day, is retested. A false breakout there will offer a chance for the pair to rise again, aiming for a recovery toward the 1.3380 intermediate resistance. A breakout and subsequent downward retest of this range will increase the likelihood of a bullish trend continuation, removing sellers' stop orders and providing a suitable entry point for long positions, with a potential rise to 1.3425, the weekly high. The ultimate target would be the 1.3468 level, where I plan to take profits.
If GBP/USD declines and no bullish activity is observed around 1.3336 in the second half of the day, the pressure on the pair will likely increase, pushing it toward the 1.3300 support. A false breakout there would be a suitable condition for opening long positions. I intend to buy GBP/USD immediately on a rebound from the 1.3262 low, aiming for an intraday correction of 30-35 points.
Requirements for Opening Short Positions on GBP/USD:
Sellers have taken action, but their impact is evident on the chart. The primary task now is to defend the 1.3380 resistance, which is likely to be tested if U.S. data is weak. A false breakout at this level, similar to the scenario described earlier, will provide a good entry point for selling the pound, targeting a correction toward the 1.3336 support. A breakout and upward retest of this range will weaken buyers' positions, removing stop orders and opening the path to the 1.3300 level. The ultimate target would be the 1.3262 level, where I will take profits.
If GBP/USD rises and there is no bearish activity around 1.3380 in the second half of the day, which is possible given the current bullish trend, buyers may continue pushing the pound higher. In that case, the bears will have no choice but to retreat to the 1.3425 resistance level. I will sell there only on a false breakout. If there's no downward movement there, I will look for short positions on a rebound from 1.3468, aiming for a 30-35 point correction.

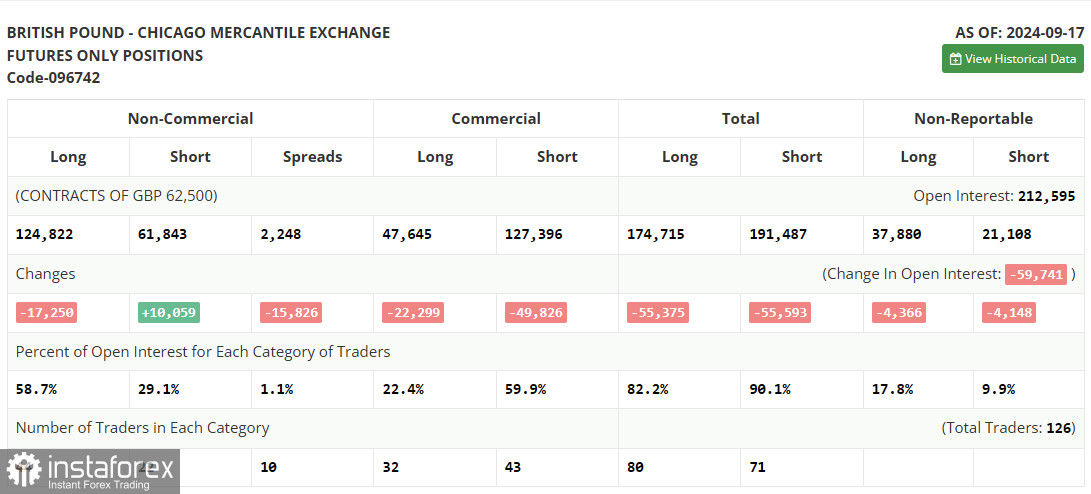
In the Commitment of Traders (COT) report dated September 17, there was a rise in short positions and a reduction in long positions. After the Bank of England left monetary policy unchanged and the Federal Reserve cut interest rates, pound buyers increased significantly. However, this has not been fully reflected in the current report, so it's not necessary to place too much emphasis on it. To be fair, the rise in short positions did not significantly impact the medium-term bullish trend. Therefore, the lower the pound goes, the more attractive it becomes to new buyers. The latest COT report indicated that long non-commercial positions fell by 17,250 to 124,822, while short non-commercial positions increased by 10,059 to 61,843. Consequently, the spread between long and short positions decreased by 342.
Indicator Signals:
Moving Averages
Trading is occurring around the 30 and 50-day moving averages, indicating market uncertainty.
Note: The periods and prices of the moving averages considered by the author are based on the H1 hourly chart and differ from the general definition of classical daily moving averages on the D1 daily chart.
Bollinger Bands
In case of a decline, the lower boundary of the indicator around 1.3300 will act as support.
Indicator Descriptions:
- Moving average: Defines the current trend by smoothing volatility and noise. Period 50, marked in yellow on the chart.
- Moving average: Defines the current trend by smoothing volatility and noise. Period 30, marked in green on the chart.
- MACD Indicator (Moving Average Convergence/Divergence): Fast EMA period 12, Slow EMA period 26, SMA period 9.
- Bollinger Bands: Period 20.
- Non-commercial traders: Speculators, such as individual traders, hedge funds, and large institutions that use the futures market for speculative purposes and meet certain requirements.
- Long non-commercial positions: Represent the total long open positions held by non-commercial traders.
- Short non-commercial positions: Represent the total short open positions held by non-commercial traders.
- The total non-commercial net position: The difference between short and long positions held by non-commercial traders.
 English
 Русский
 Bahasa Indonesia
 Bahasa Malay
 ไทย
ไทย Español
 Deutsch
 Български
 Français
 Tiếng Việt
 中文
中文 বাংলা
বাংলা हिन्दी
 Čeština
 Українська
 Română

