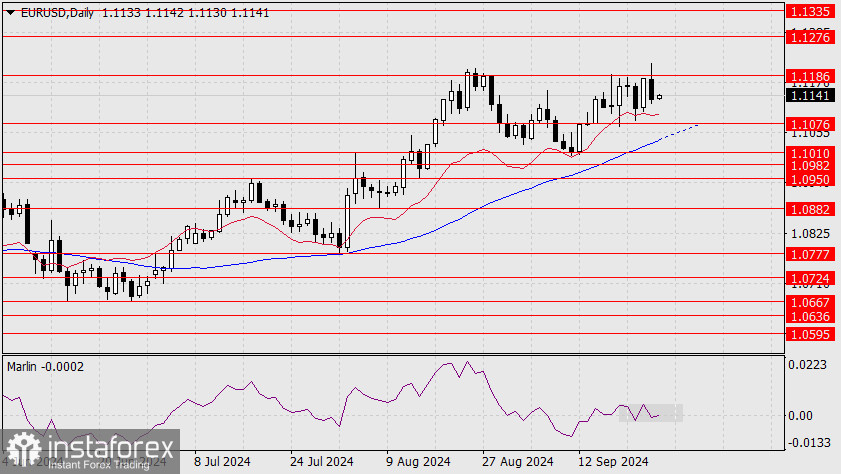
On Wednesday, the euro fell by 45 pips amid a 0.19% decline in the S&P 500, a 2.78% drop in oil prices, and an increase in the yield of 5-year US government bonds from 3.47% to 3.53%. However, there are no clear reversal signals for any of these instruments. The main risk indicator—the S&P 500 stock index—still has growth potential up to around 5850 and in terms of time until November, coinciding with the US presidential elections.

On the daily chart, the Marlin oscillator's signal line forms a sideways range along the zero line, creating a base for a potential breakout upward. A repeated breakout above the 1.1186 level might be more successful, with the subsequent target being 1.1276 (the July 2023 high). If the price breaks through the 1.1076 support level along with the MACD line, it could create a condition for a medium-term decline.

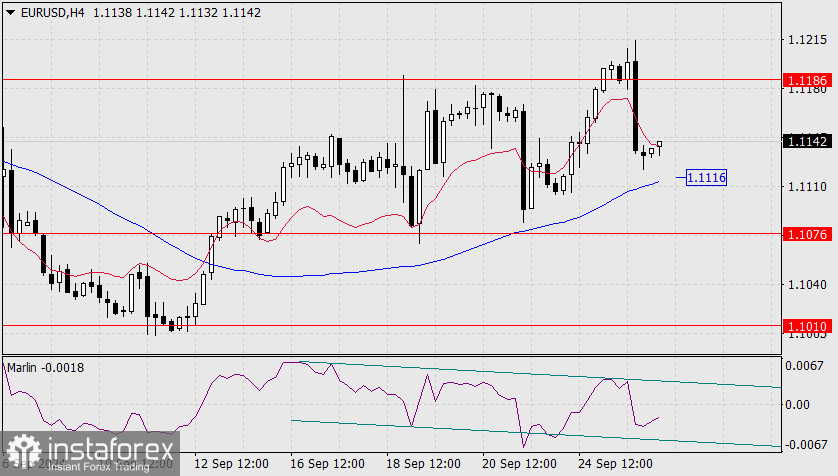
On the four-hour chart, the sign of an attack on the 1.1076 level would be the price breaking through the MACD line around the 1.1116 mark. The Marlin oscillator is in downtrend territory, which may prompt the price to move in that direction.
However, the oscillator's potential for further decline is limited, as it is currently attempting to distance itself from the lower boundary of its own descending channel. The balance between the two analyzed timeframes indicates an advantage for the uptrend.
 English
 Русский
 Bahasa Indonesia
 Bahasa Malay
 ไทย
ไทย Español
 Deutsch
 Български
 Français
 Tiếng Việt
 中文
中文 বাংলা
বাংলা हिन्दी
 Čeština
 Українська
 Română

