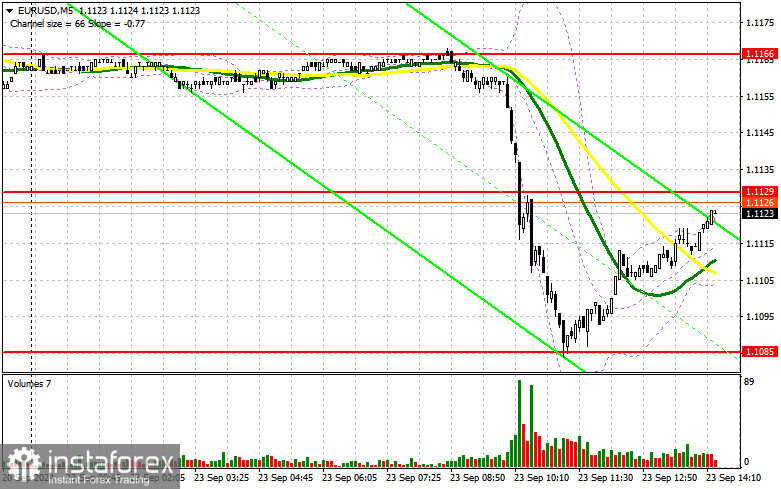
In my morning forecast, I highlighted the 1.1129 level and planned to make market entry decisions based on it. Let's look at the 5-minute chart and analyze what happened. The rise to the 1.1129 level occurred, but there was no test or formation of a false breakout at that level. As a result, I was left without suitable entry points. The technical picture for the second half of the day remained unchanged.

To open long positions on EUR/USD:
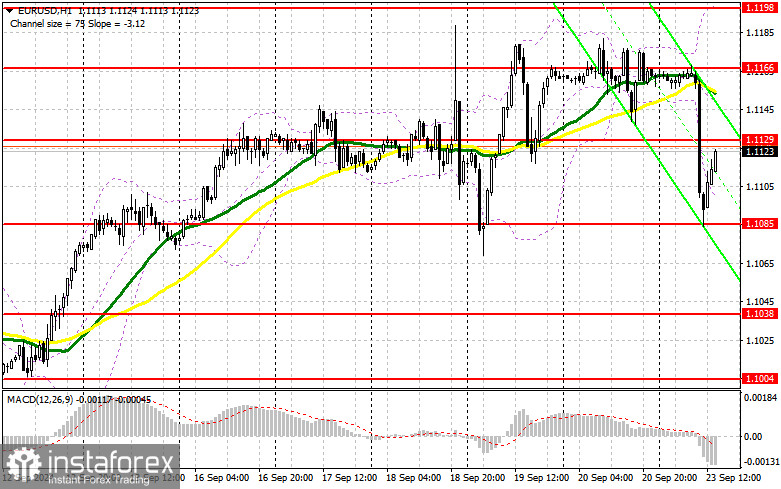
We are awaiting data on U.S. economic activity, which may help the dollar regain its leading position. Data on the Manufacturing PMI, the Services PMI, and the Composite PMI for the U.S. for August is expected. I should remind you that similar economic data for the Eurozone were quite disappointing, leading to pressure on the pair. It's also worth paying attention to what FOMC members Raphael Bostic, Austan D. Goolsbee, and Neel Kashkari will say during their interviews. Bostic and Kashkari, in particular, usually take a more conservative stance regarding changes in monetary policy, which could be favorable for the dollar. In the case of very strong U.S. statistics, the euro will likely experience another drop, which I plan to take advantage of. A false breakout formation around the nearest support level at 1.1085 will create all the necessary conditions for long positions, aiming for the pair's recovery and a return to 1.1129—the midpoint of the sideways channel formed in the first half of the day. A breakout and consolidation above this range could lead to further growth, with the potential to test 1.1166, where the moving averages are located. The furthest target will be the 1.1198 maximum, where I will fix profits. If EUR/USD declines and there is no activity around 1.1085 in the second half of the day, pressure on the pair will persist. This could lead to a more significant sell-off. In this case, I will only enter long positions after forming a false breakout near the next support at 1.1038. I plan to open long positions on an immediate rebound from 1.1004, aiming for an intraday upward correction of 30-35 points.
To open short positions on EUR/USD:
Sellers have a chance for a further decline in the euro, provided that strong U.S. data is released. A false breakout formation near 1.1129, following the release of several reports, will be a suitable condition for opening short positions. The target will be a return to the support area of 1.1085, established in the first half of the day. A breakout and consolidation below this range, followed by a retest from bottom to top, will provide another selling opportunity, with the movement directed toward the 1.1038 level, where I expect larger euro buyers to emerge. The furthest target will be around 1.1004, which would completely nullify the bulls' plans for further growth. This is where I will lock in profits. If the EUR/USD moves up and bears do not appear at 1.1129, the market will find equilibrium. In such a case, I will postpone selling until the next resistance around 1.1166. I will also sell there, but only after an unsuccessful consolidation attempt. I plan to open short positions on a prompt rebound from 1.1198, aiming for a downward correction of 30-35 points.

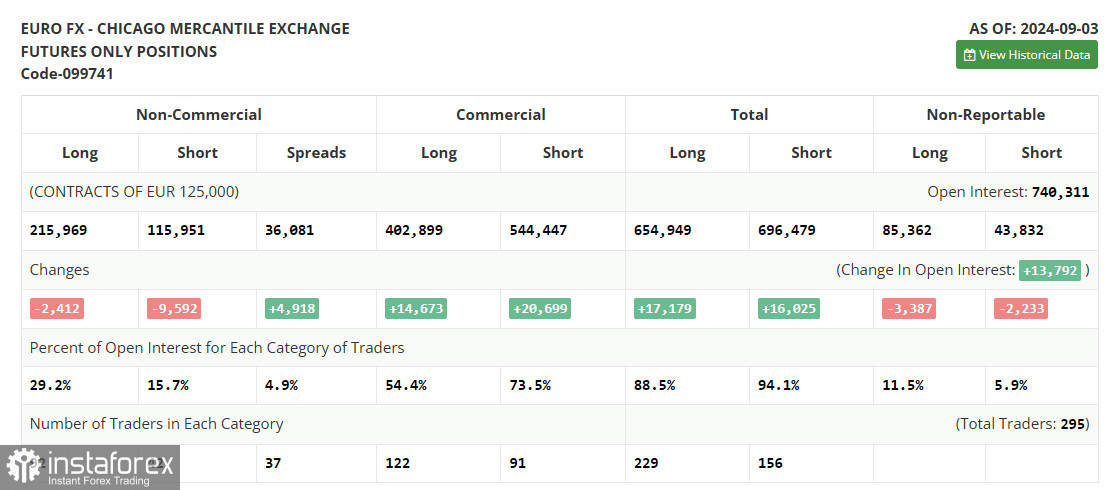
The Commitment of Traders (COT) report for September 3 showed a reduction in both long and short positions. Although there were far fewer euro sellers, the overall technical picture for the pair's downward trend remained unaffected. Most likely, the euro will continue to decline against the dollar this week, as we have the European Central Bank meeting ahead, where we'll learn about the next interest rate cut in the Eurozone and the future course of monetary policy. However, this does not negate the medium-term upward trend for the euro, and the lower the pair goes, the more attractive it will become for buying. The COT report indicated that non-commercial long positions fell by 2,412 to 215,969, while non-commercial short positions dropped by 9,592 to 115,951. As a result, the difference between long and short positions increased by 4,918.
Indicator Signals:
Moving Averages:
Trading is conducted below the 30- and 50-day moving averages, indicating risks of a euro decline.
Note: The period and prices of moving averages considered by the author are on the H1 hourly chart and differ from the general definition of classic daily moving averages on the D1 daily chart.
Bollinger Bands:
In case of a decline, the lower boundary of the indicator around 1.1100 will act as support.
Indicator Descriptions:
- Moving Average: Defines the current trend by smoothing volatility and noise. Period 50. Marked in yellow on the chart.
- Moving Average: Defines the current trend by smoothing volatility and noise. Period 30. Marked in green on the chart.
- MACD (Moving Average Convergence/Divergence): Fast EMA period 12, Slow EMA period 26, SMA period 9.
- Bollinger Bands: Period 20
- Non-commercial traders: Speculators such as individual traders, hedge funds, and large institutions using the futures market for speculative purposes and meeting specific criteria.
- Non-commercial long positions: Represent the total long open positions of non-commercial traders.
- Non-commercial short positions: Represent the total short open positions of non-commercial traders.
- Total non-commercial net position: The difference between non-commercial traders' short and long positions.
 English
 Русский
 Bahasa Indonesia
 Bahasa Malay
 ไทย
ไทย Español
 Deutsch
 Български
 Français
 Tiếng Việt
 中文
中文 বাংলা
বাংলা हिन्दी
 Čeština
 Українська
 Română

