 English
  Русский
 Bahasa Indonesia
 Bahasa Malay
 ไทย
ไทย Español
 Deutsch
 Български
 Français
 Tiếng Việt
 中文
中文 বাংলা
বাংলা हिन्दी
 Čeština
 Українська
 Română

Trend-following analysis (figure 1)
On Monday, the market may try to start moving down from the level of 1.3318 (Friday's daily candle close), targeting 1.3289 – the 14.6% retracement level (red dashed line). From this level, the price is likely to continue moving up towards 1.3339 – the upper fractal (red dashed line).
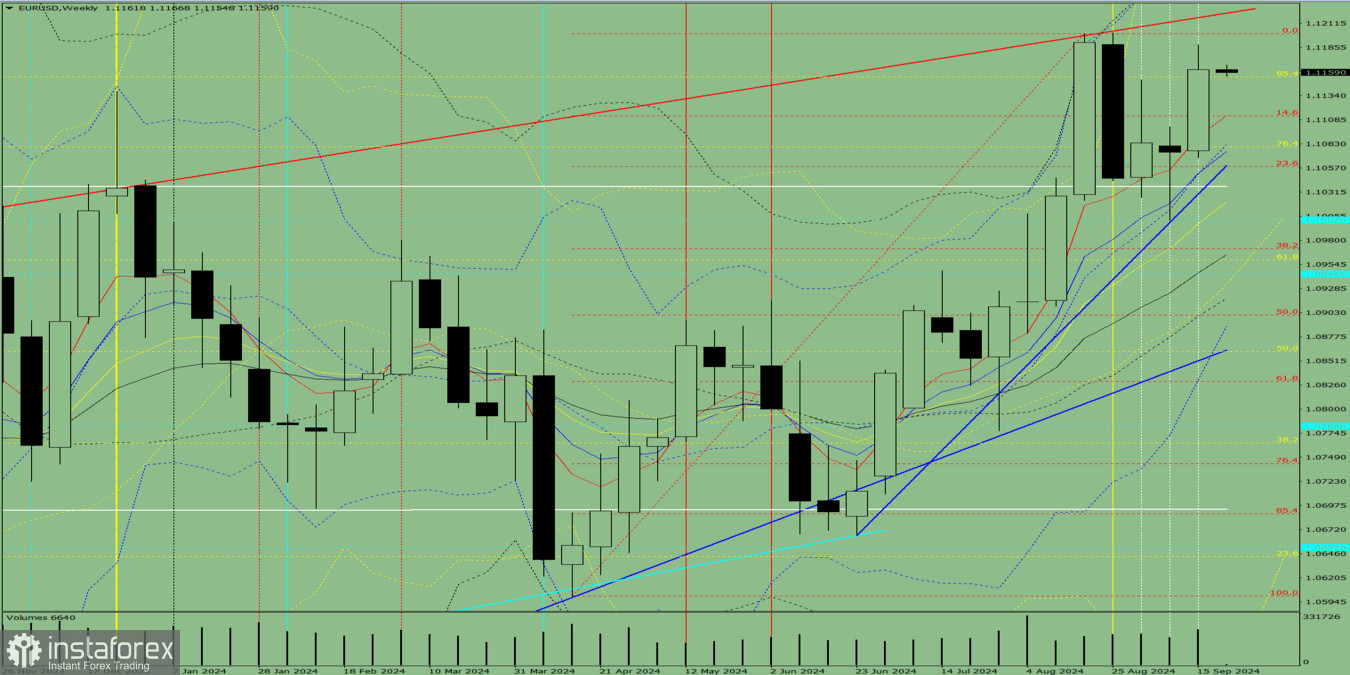
Figure 1 (daily chart)
Complex analysis
Indicator analysis – down
Fibonacci levels – down
Trade volume – down
Candlestick analysis – down
Trend-following analysis – up
Bollinger bands – down
Weekly chart – down
Conclusion
Today, from the level of 1.3318 (Friday's daily candle close), the price will attempt to start moving down towards 1.3289 – the 14.6% retracement level (red dashed line). From this level, EUR/USD may continue moving up towards 1.3339 – the upper fractal (red dashed line).
Alternative scenario. From the level of 1.3318 (Friday's daily candle close), the price will attempt to start moving down towards 1.3289 – the 14.6% retracement level (red dashed line). From this level, the instrument may continue moving down towards 1.3259 – the 23.6% retracement level (red dashed line).