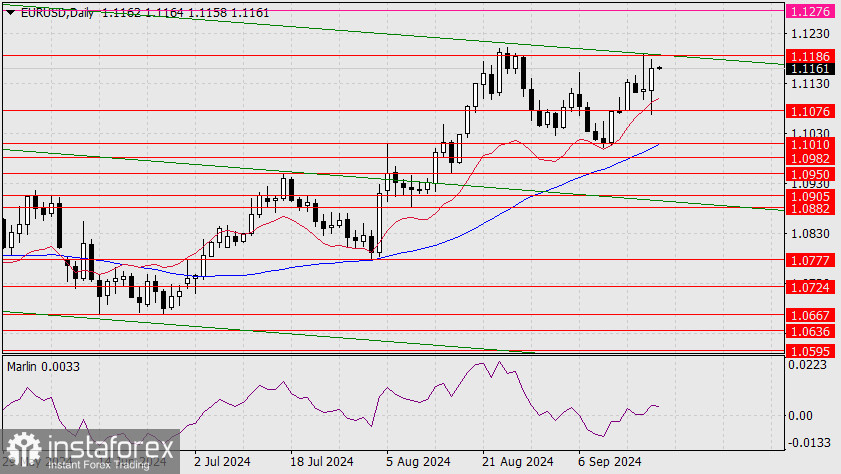
The euro's second attempt to overcome the resistance at 1.1186 yesterday was unsuccessful — the price had to climb too far from the day's low, starting from the support at 1.1076. The bulls have something to fight for, as breaking the July 2023 peak at 1.1276 opens a long-term growth perspective, potentially even reaching the double peak of 2020/21, above the 1.2270 level.

However, despite the proximity to such a strategic level, the main bearish scenario remains strong enough that we expect the price to move into the target range of 1.0882-1.0905 within 20 days, at a rate of 20 pips per trading day. To form a signal to trigger the development of this primary scenario, the Marlin oscillator must break through the zero line downwards. The first target is the 1.1076 support.

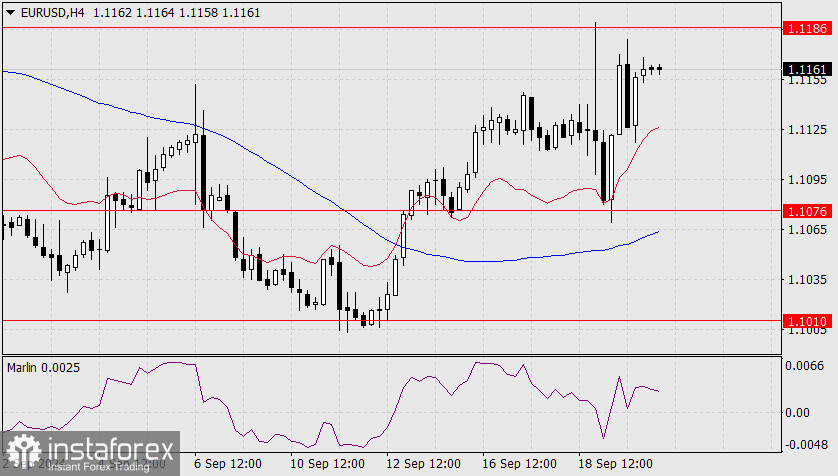
The price is trying to rise above both indicator lines on the four-hour chart. Even the MACD line is pointing upwards. But the primary scenario is supported by the leading Marlin oscillator, which was in bearish territory yesterday and is now turning to retest the boundary. Since the price has turned the 1.1076-1.1186 range into a zone of free movement, a reversal signal will occur when the price moves below the lower boundary of this range. The MACD line is approaching this level, attempting to reinforce support.
 English
 Русский
 Bahasa Indonesia
 Bahasa Malay
 ไทย
ไทย Español
 Deutsch
 Български
 Français
 Tiếng Việt
 中文
中文 বাংলা
বাংলা हिन्दी
 Čeština
 Українська
 Română

