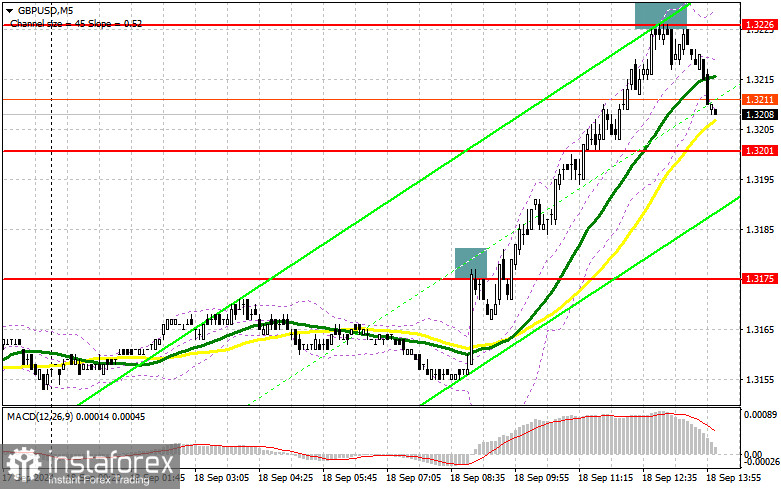
In my morning forecast, I highlighted the 1.3175 level and planned to make trading decisions based on it. Let's look at the 5-minute chart and see what happened. A rise followed by a false breakout at 1.3175 led to a selling entry for the pound, which resulted in only a 10-point correction before buyers stepped back in. The technical outlook has been revised for the second half of the day.

To open long positions on GBP/USD:
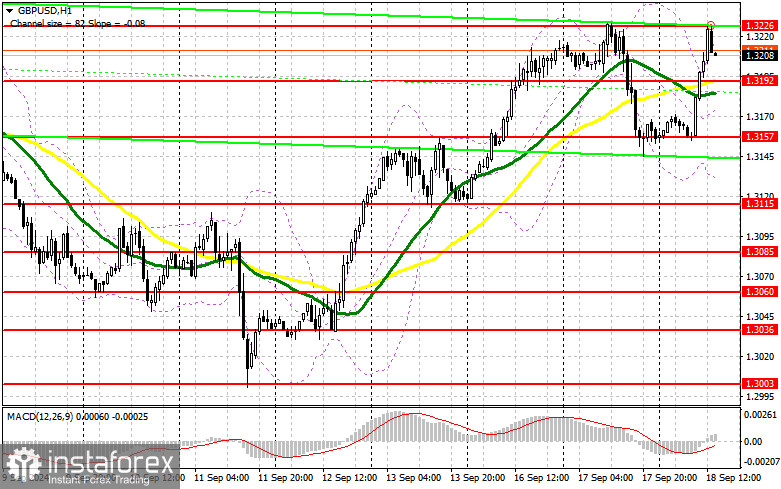
The news that U.K. monthly inflation has increased, though in line with economists' forecasts, triggered a rise in the pound in the first half of the day. For the bullish market to continue, buyers will need a dovish tone from the Fed and an immediate rate cut of 0.5%. Additionally, U.S. building permits and housing starts data will be released, but this data is unlikely to play a major role. In the event of a negative reaction to the FOMC's outcome, a false breakout around the new support at 1.3192, just below the moving averages, will provide a chance for the pair to continue rising, with a retest of 1.3226—a level that hasn't been breached today. A breakout and retest from above to below this range will strengthen the bullish trend, triggering stop-losses and creating an opportunity for long positions, targeting 1.3263. The final target will be the 1.3300 level, where I plan to take profits. If GBP/USD declines and there's no buying activity around 1.3192 in the second half of the day, pressure on the pair will increase. This will lead to a drop and a retest of the next support at 1.3157, disrupting buyers' plans for further growth. Only a false breakout there will provide a good entry point for long positions. I will open long positions at the first opportunity on a rebound from the 1.3115 low, targeting a 30-35 point correction within the day.
To open short positions on GBP/USD:
Sellers managed to fend off buyers only around the weekly high. Now, much depends on the Fed's decision, but the defense of the 1.3226 resistance remains crucial. Only a cautious stance by the U.S. regulator will help the bears achieve their goal, and a false breakout at 1.3226, similar to what I analyzed earlier, will provide a good selling point for the pound. The target will be support at 1.3192. A breakout and retest from below to above this range will hit buyers' positions, triggering stop-losses and opening the path to 1.3157. The final target will be the 1.3115 level, where I will take profits. If GBP/USD rises and there is no bearish activity around 1.3226 in the second half of the day, buyers will continue pushing the pound higher and higher. In this case, the bears will have no choice but to retreat to the 1.3263 resistance area. I will only sell there on a false breakout. If there's no downward movement, I will look for short positions on a rebound from 1.3300, targeting a 30-35 point downward correction within the day.

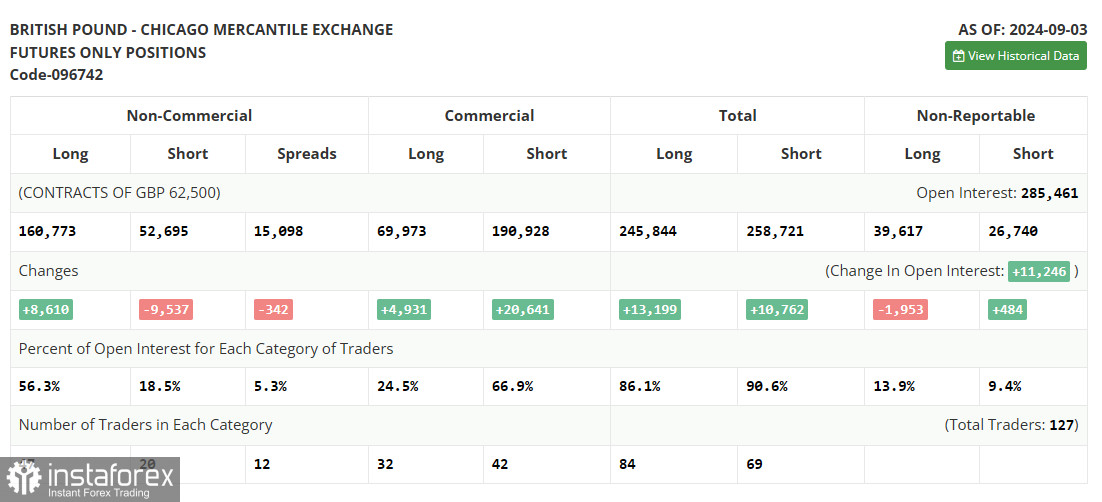
The Commitment of Traders (COT) report for September 3 showed an increase in long positions and a reduction in short positions. It is clear that even with the pair's correction, traders are confident that the rate cuts in the U.S. are much more significant than similar actions by the Bank of England. The market is likely pricing in the future reduction in borrowing costs in the U.K., and demand for the pound is bound to return in the near future since the medium-term upward trend remains intact. As the pair declines, it becomes more attractive for new purchases. The ratio of long to short positions—three times fewer shorts—speaks for itself. The latest COT report indicated that long non-commercial positions increased by 8,610 to 160,773, while short non-commercial positions decreased by 9,537 to 52,695. As a result, the gap between long and short positions decreased by 342.
Indicator signals:
Moving averages
Trading is conducted above the 30- and 50-day moving averages, indicating further growth of the pair.
Note: The period and prices of moving averages are considered by the author on the hourly H1 chart and differ from the general definition of classic daily moving averages on the D1 daily chart.
Bollinger Bands
In the case of a decline, the lower boundary of the indicator around 1.3135 will act as support.
Indicator descriptions:
- Moving average: Determines the current trend by smoothing volatility and noise. Period 50. Marked in yellow on the chart.
- Moving average: Determines the current trend by smoothing volatility and noise. Period 30. Marked in green on the chart.
- MACD indicator (Moving Average Convergence/Divergence): Fast EMA period 12. Slow EMA period 26. SMA period 9.
- Bollinger Bands: Period 20.
- Non-commercial traders: Speculators such as individual traders, hedge funds, and large institutions using the futures market for speculative purposes and meeting specific requirements.
- Long non-commercial positions: Represent the total long open position of non-commercial traders.
- Short non-commercial positions: Represent the total short open position of non-commercial traders.
- Total non-commercial net position: The difference between short and long positions of non-commercial traders.
 English
 Русский
 Bahasa Indonesia
 Bahasa Malay
 ไทย
ไทย Español
 Deutsch
 Български
 Français
 Tiếng Việt
 中文
中文 বাংলা
বাংলা हिन्दी
 Čeština
 Українська
 Română

