Analysis of Tuesday's Trades:
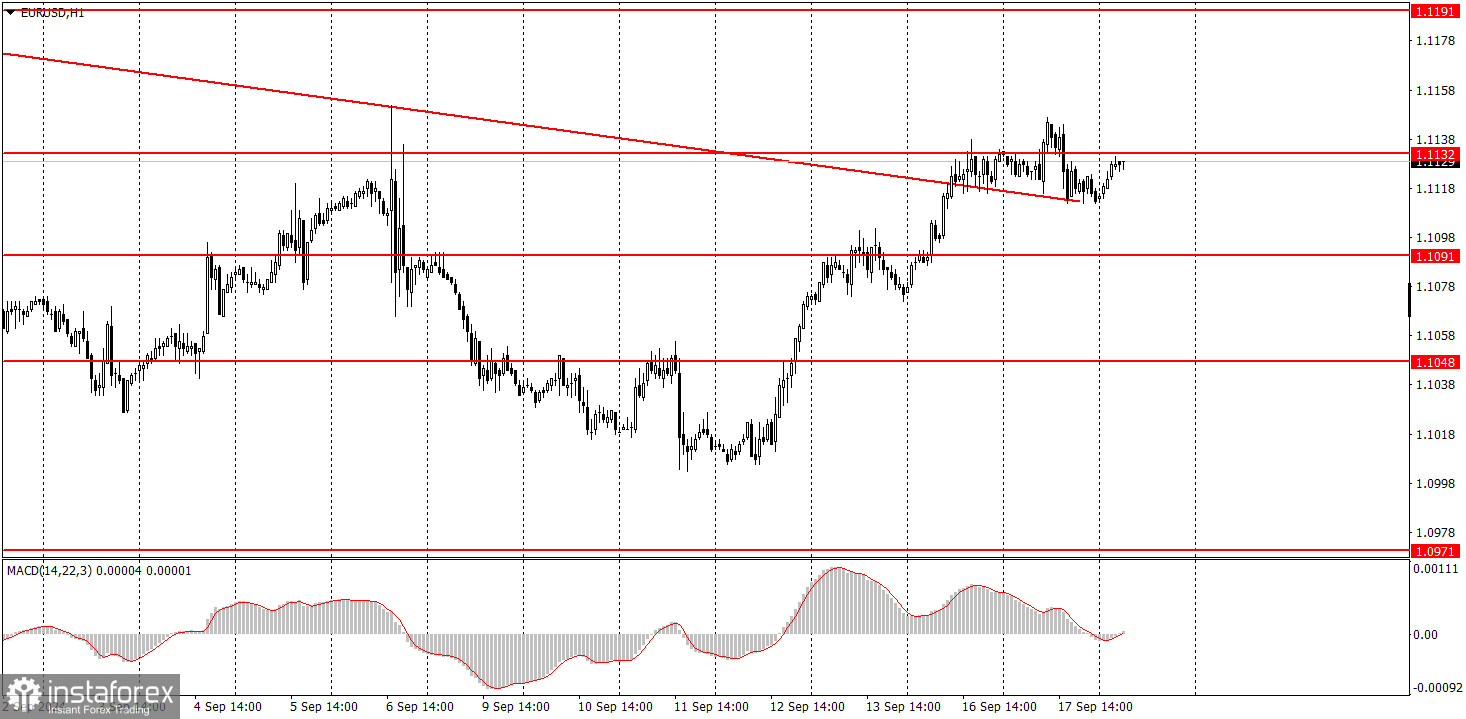
EUR/USD on 1H Chart

On Tuesday, the EUR/USD pair traded exclusively sideways. There was practically no correlation between movements and macroeconomic data throughout the day, and volatility was low. The ZEW Economic Sentiment Index for Germany and the Eurozone was published in the morning, with results several times worse than forecasts. However, this did not impact the euro, which continued to rise. Only in the second half of the day, following relatively decent reports on industrial production and retail sales in the U.S., the dollar barely gained 20 pips. We warned that Tuesday's reports had a low chance of triggering significant movements. The market continues to wait for the Federal Reserve meeting, and leading up to this event, it seems only interested in selling the U.S. dollar. It remains unclear how much the Fed will lower the rate, so the market's reaction in the evening could be unpredictable. We'll need to respond based on the situation.
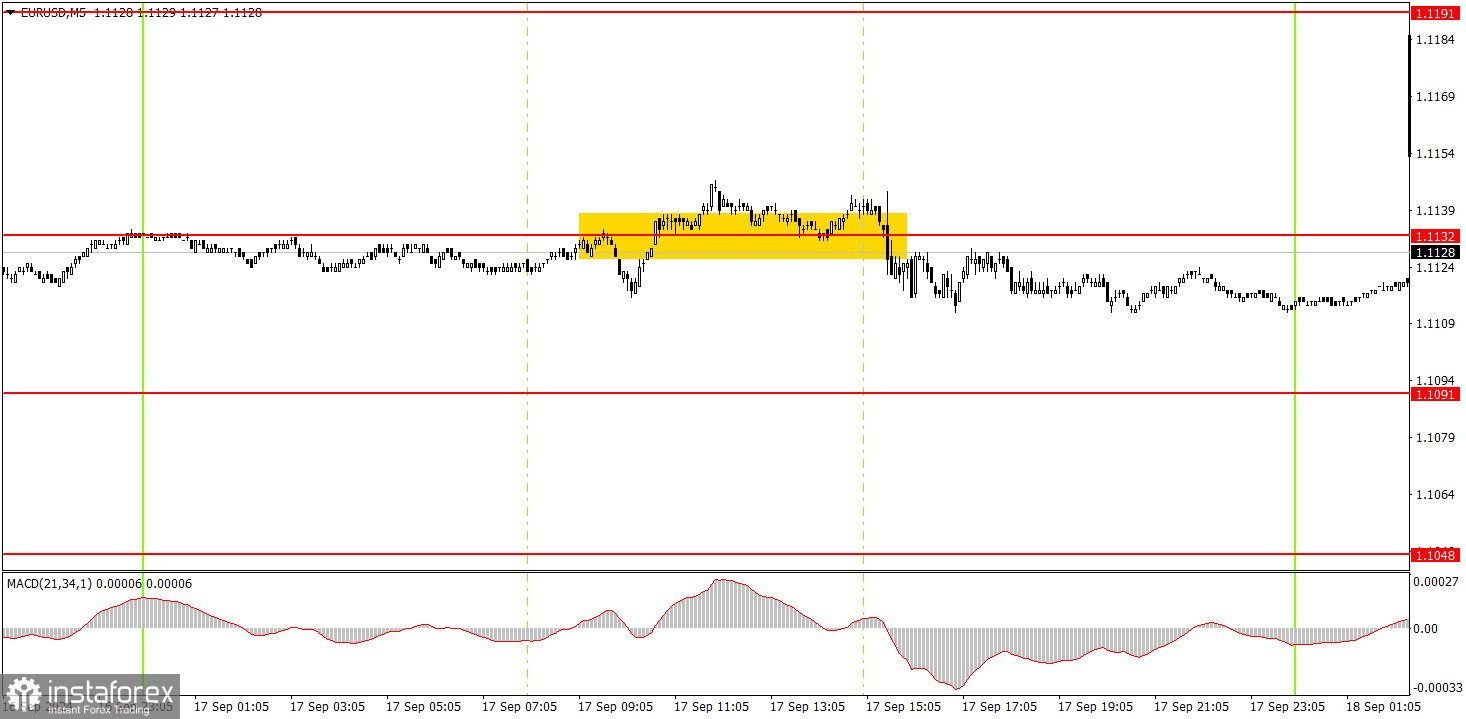
EUR/USD on 5M Chart

One sell signal was formally generated on Tuesday in the 5-minute time frame. However, the price traded sideways all day, and the accuracy of this signal near the 1.1132 level left much to be desired. During the U.S. trading session, the dollar had a chance to show the desired downward movement thanks to decent reports, but that didn't happen. The pair's decline was minimal.
How to Trade on Wednesday:
In the hourly time frame, the EUR/USD pair still can form a downward trend, but these chances are quickly fading. Unfortunately, the illogical selling of the dollar can easily resume in the medium term, as no one knows how much longer the market will continue pricing in the Fed's monetary easing. The market keeps factoring in all the future Fed rate cuts into the dollar's price while completely ignoring the European Central Bank's easing measures.
On Wednesday, novice traders can find potential trading opportunities around the 1.1132 level. A bounce from it would allow for selling while breaking through it would provide an opportunity for buying. However, there's a high likelihood of flat trading until the evening when the Fed announces the results of its meeting.
The key levels to consider on the 5M time frame are 1.0726-1.0733, 1.0797-1.0804, 1.0838-1.0856, 1.0888-1.0896, 1.0940, 1.0971, 1.1011, 1.1048, 1.1091, 1.1132, 1.1191, 1.1275-1.1292. The Eurozone will release the second estimate of the Consumer Price Index for August on Wednesday. We don't expect a market reaction to this report, as the pace of inflation decline in the EU is now irrelevant—the ECB has already lowered rates twice. In the U.S., there will be relatively unimportant reports on new home sales and building permits. However, the critical event of the week will be the Fed meeting in the evening.
Basic Rules of the Trading System:
1) The strength of a signal is determined by the time it takes for the signal to form (bounce or level breakthrough). The less time it took, the stronger the signal.
2) If two or more trades were opened around any level due to false signals, subsequent signals from that level should be ignored.
3) In a flat market, any currency pair can form multiple false signals or none at all. In any case, it's better to stop trading at the first signs of a flat market.
4) Trades should be opened between the start of the European session and midway through the U.S. session. After this period, all trades must be closed manually.
5) In the hourly time frame, trades based on MACD signals are only advisable amidst good volatility and a trend confirmed by a trendline or trend channel.
6) If two levels are too close to each other (5 to 20 pips), they should be considered a support or resistance area.
7) After moving 15 pips in the intended direction, the Stop Loss should be set to break even.
What's on the Charts:
Support and Resistance price levels: targets for opening long or short positions. You can place Take Profit levels around them.
Red lines: channels or trend lines that depict the current trend and indicate the preferred trading direction.
The MACD indicator (14,22,3): encompassing both the histogram and signal line, acts as an auxiliary tool and can also be used as a source of signals.
Important speeches and reports (always noted in the news calendar) can profoundly influence the movement of a currency pair. Hence, trading during their release calls for heightened caution. It may be reasonable to exit the market to avoid sharp price reversals against the prevailing movement.
For beginners, it's important to remember that not every trade will yield profit. Developing a clear strategy and effective money management is key to success in trading over the long term.
 English
 Русский
 Bahasa Indonesia
 Bahasa Malay
 ไทย
ไทย Español
 Deutsch
 Български
 Français
 Tiếng Việt
 中文
中文 বাংলা
বাংলা हिन्दी
 Čeština
 Українська
 Română

