Analysis of EUR/USD 5M

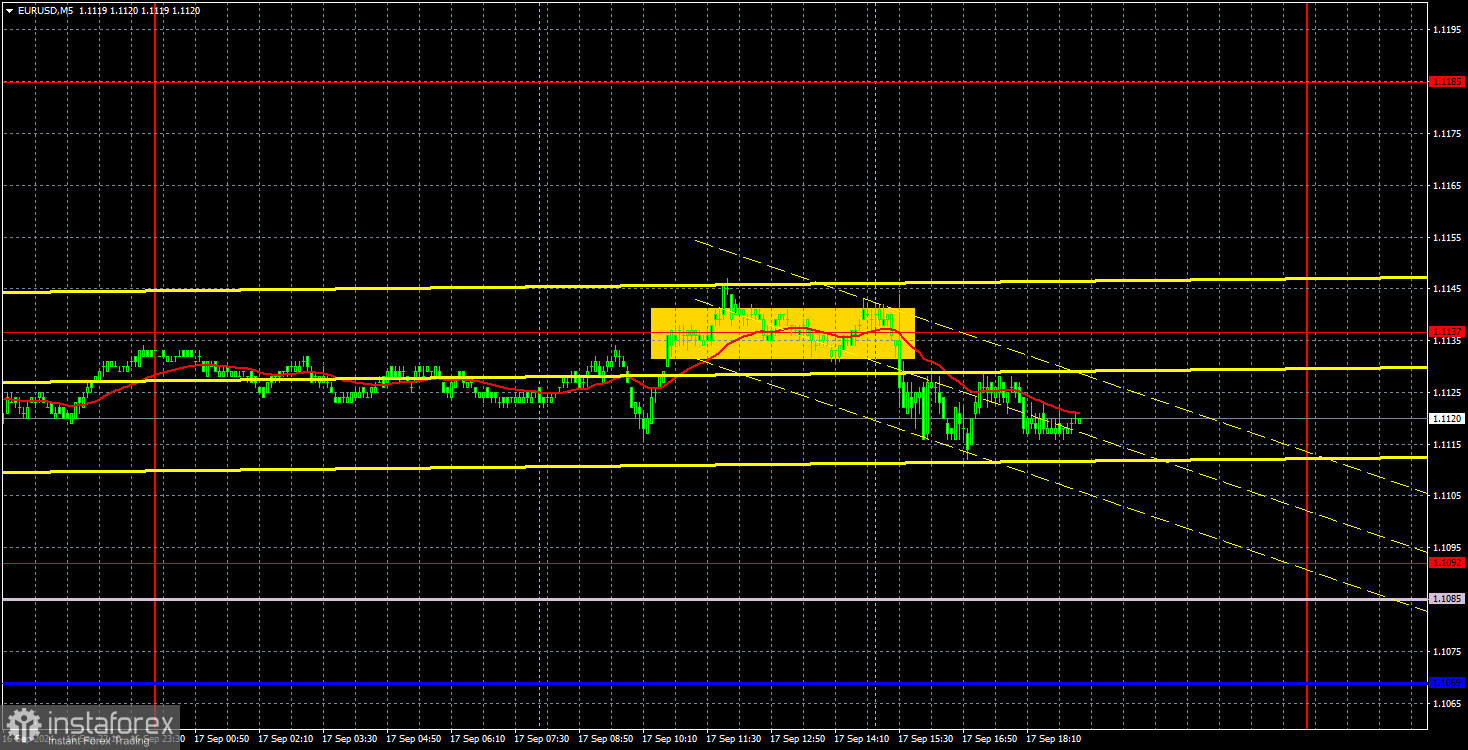
The EUR/USD pair was practically motionless on Tuesday. In the first half of the day, we saw a slight strengthening of the euro even though the ZEW economic sentiment indices for Germany and the EU were significantly worse than expected. In the second half of the day, the U.S. dollar gained some ground, as U.S. data were finally a bit better than the market's expectations. However, even here, one could nitpick, as industrial production grew by 0.8% (with forecasts of +0.2%), but the previous figure was revised downward. The most interesting part is that the British pound plunged at the same time. Under the current circumstances, any drop in the pound seems logical and justified, given its overbought condition and illogical growth in recent months. But why, then, is the euro standing still?
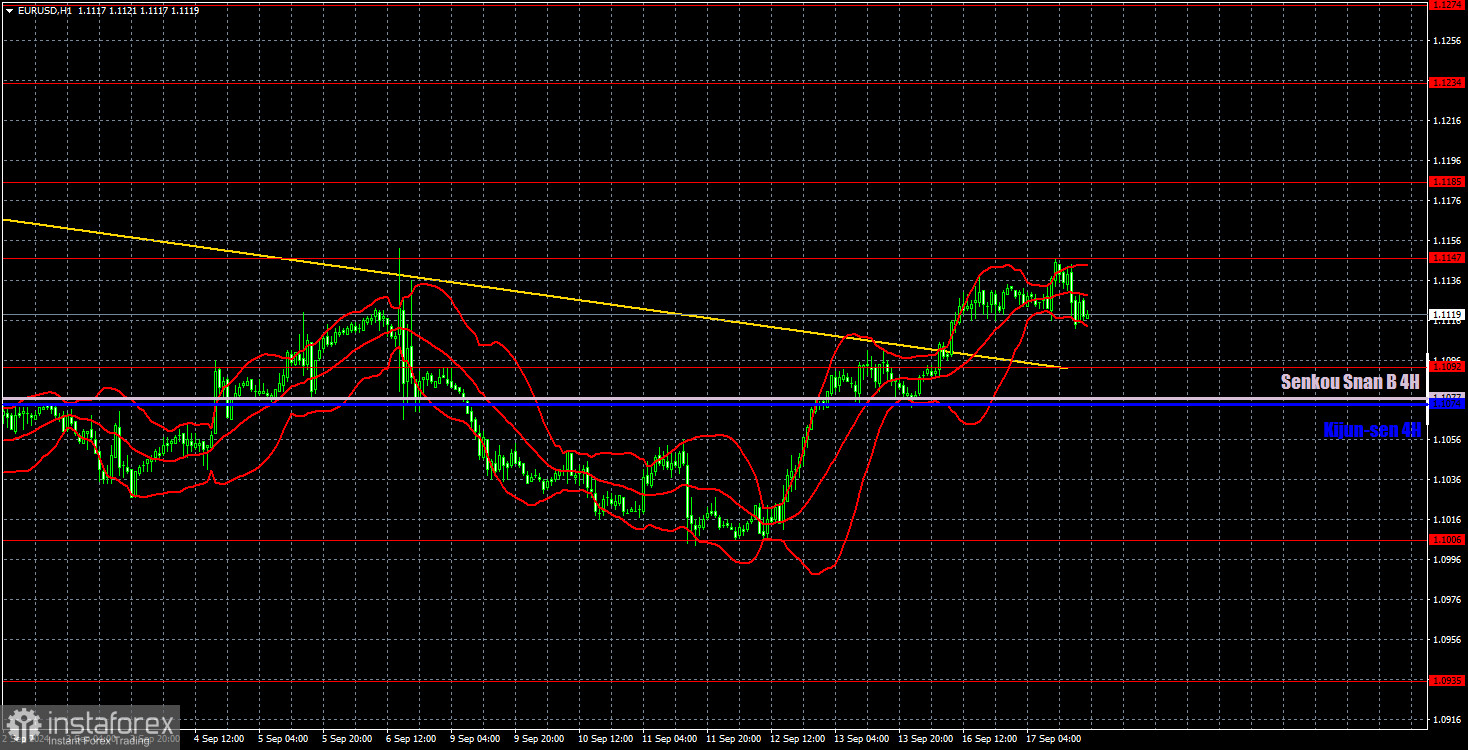
The pair has broken through the trend line and both lines of the Ichimoku indicator, so the trend has turned bullish. However, it couldn't break through its most recent local high of 1.1152. Therefore, technically, the downtrend could still resume. What to expect from the market tomorrow is probably known only to God. Right now, it's unclear what decision the Federal Reserve will make, not to mention Fed Chair Jerome Powell's rhetoric or the "dot-plot" graph.
Yesterday, there was only one trading signal, which was both highly inaccurate and weak. Volatility was low again, and although traders were entitled to open short positions, they could only have gained a maximum of 10-15 pips of profit, as the price failed even to reach the nearest level of 1.1092.
COT report:

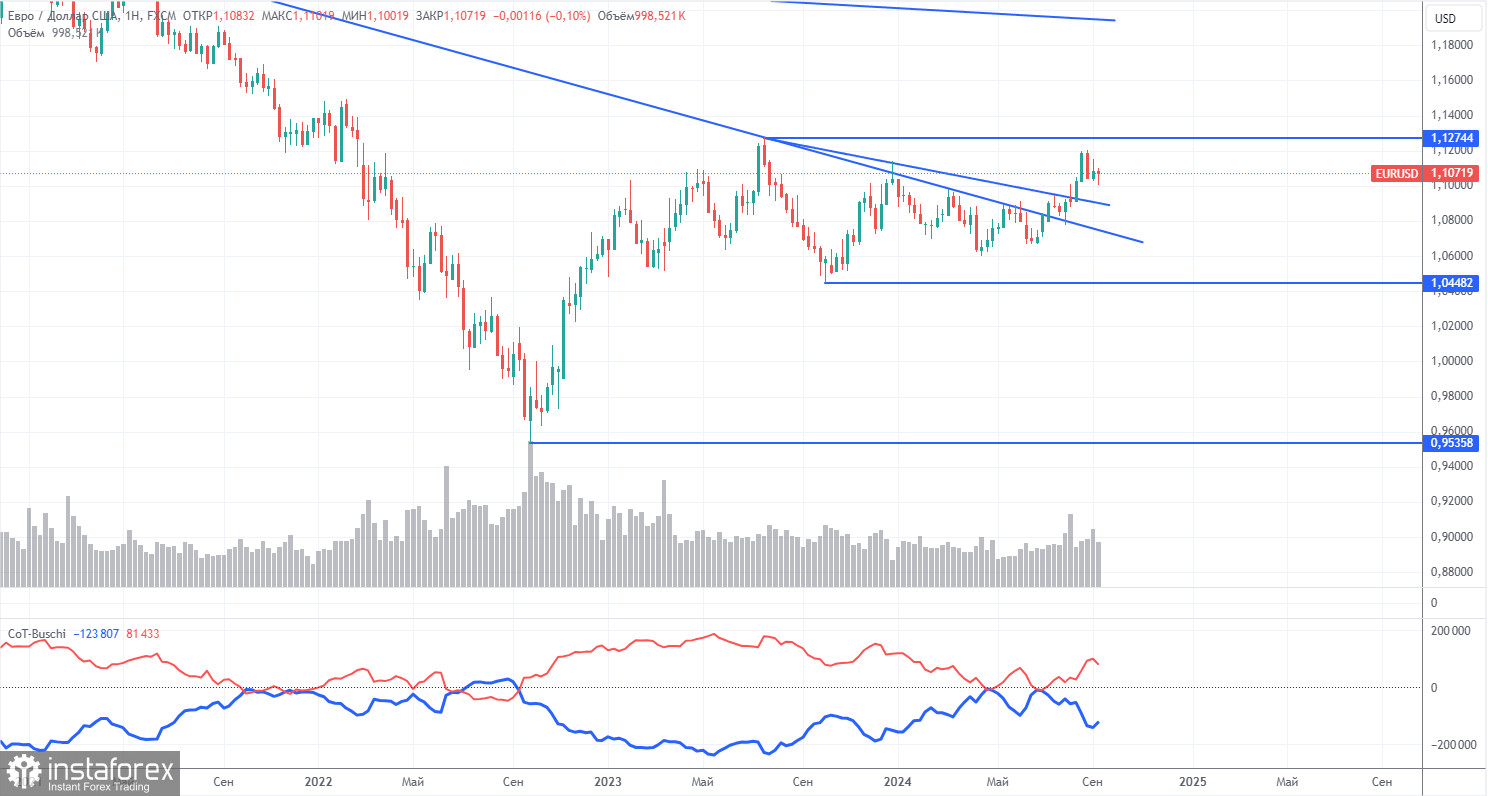
The latest COT report is dated September 10. The illustration above clearly shows that the net position of non-commercial traders has remained bullish for a long time. The bears' attempt to take over failed miserably. The net position of non-commercial traders (red line) declined in the second half of 2023 and early 2024, while commercial traders (blue line) increased. Currently, professional players are again increasing their long positions.
We also still do not see any fundamental factors supporting the strengthening of the euro. Technical analysis indicates that the price is in a consolidation phase—in other words, a flat. In the weekly time frame, it is clear that since December 2022, the pair has been trading between levels 1.0448 and 1.1274. In other words, we have moved from a seven-month flat into an 18-month one.
The red and blue lines are diverging at the moment, indicating that long positions on the euro are increasing. However, such changes cannot be a basis for long-term conclusions within a flat trend. During the last reporting week, the number of long positions in the non-commercial group decreased by 23,100, while the number of short positions fell by 4,500. Accordingly, the net position decreased by 18,600. Nevertheless, the euro still has the potential to fall.
Analysis of EUR/USD 1H

In the hourly time frame, the EUR/USD pair finally has a real chance to end the baseless upward trend, but these chances are quickly fading. The trendline and the Senkou Span B line have been broken. Now, the global uptrend is likely to resume. There's no point in discussing the fundamental and macroeconomic reasons for a new drop in the dollar — they don't exist. However, price movement depends solely on the market itself, and the market can trade in any direction, regardless of the news.
For September 18, we highlight the following levels: 1.0658-1.0669, 1.0757, 1.0797, 1.0843, 1.0889, 1.0935, 1.1006, 1.1092, 1.1147, 1.1185, 1.1234, 1.1274, as well as the Senkou Span B line (1.1077) and the Kijun-sen line (1.1074). The Ichimoku indicator lines can move during the day, so this should be considered when identifying trading signals. Remember to set a Stop Loss to break even if the price has moved in the intended direction by 15 pips. This will protect you against potential losses if the signal turns out to be false.
On Wednesday, the final inflation estimate for August will be released in the Eurozone, which is unlikely to differ from the initial estimate and will probably not attract much interest. In the U.S., reports on building permits and new home sales will be published. In the evening, the Fed meeting, the key interest rate decision announcement, the "dot-plot" chart, and a press conference with Powell will occur. Wednesday evening and Thursday may be filled with "market swings."
Explanation of illustrations:
Support and resistance levels: Thick red lines near which the trend may end. They are not sources of trading signals.
Kijun-sen and Senkou Span B lines: These Ichimoku indicator lines, transferred from the 4-hour timeframe to the hourly chart, are strong lines.
Extreme levels: Thin red lines from which the price previously bounced. These provide trading signals.
Yellow lines: Trend lines, trend channels, and other technical patterns.
Indicator 1 on COT charts: The net position size for each category of traders.
 English
 Русский
 Bahasa Indonesia
 Bahasa Malay
 ไทย
ไทย Español
 Deutsch
 Български
 Français
 Tiếng Việt
 中文
中文 বাংলা
বাংলা हिन्दी
 Čeština
 Українська
 Română

