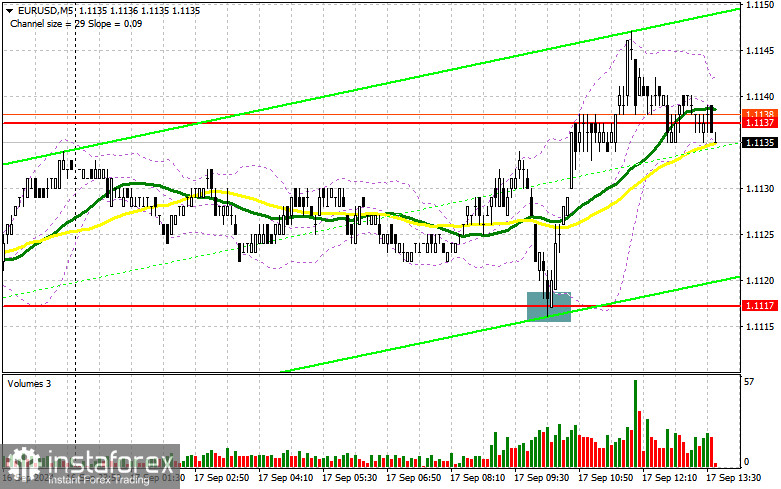
In my morning forecast, I focused on the 1.1117 level and planned to make trading decisions based on it. Let's look at the 5-minute chart and analyze what happened. A decline and a false breakout around 1.1117 triggered a buy signal for the euro, resulting in the pair rising by more than 25 points. The technical picture has been revised for the second half of the day.

To open long positions on EUR/USD:
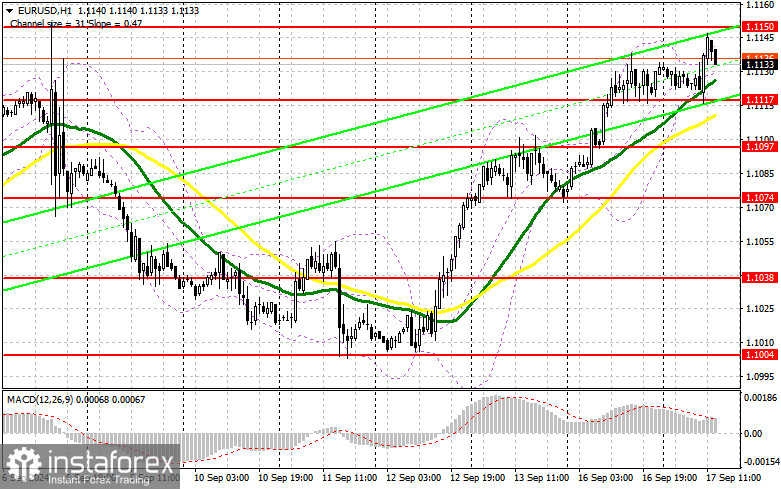
As expected, the euro reacted with a decline due to weak data from the ZEW institute on Germany and the Eurozone, which limited the pair's upside potential after the morning's bullish momentum. In the second half of the day, more interesting and important statistics related to the U.S. economy are expected. We anticipate figures on the change in retail sales volume for August this year, industrial production, and manufacturing output. FOMC member Lorie K. Logan's speech is unlikely to be of interest, as she won't address future rate prospects. In the event of very strong data and a bearish reaction, I expect buyers to emerge around the same support level of 1.1117, which performed well in the first half of the day. A false breakout there will create all the necessary conditions for long positions, continuing the bullish trend toward recovery around 1.1150, a resistance level that almost coincides with last week's high. A breakout and upward consolidation above this range will lead to a rise in the pair with the chance of testing 1.1176. The furthest target will be the 1.1199 high, where I will take profits. If EUR/USD declines and there is no activity around 1.1117 in the second half of the day, the pressure on the pair will increase, leading to a larger sell-off. In that case, I will only enter after a false breakout forms around the next support at 1.1097, where the moving averages are slightly above. I plan to open long positions immediately on a rebound from 1.1074, aiming for an intraday upward correction of 30-35 points.
To open short positions on EUR/USD:
Frankly speaking, sellers have little chance, so I will act only after a rise and a new weekly high. The level of 1.1150 is suitable for me, where a false breakout, combined with strong U.S. statistics, will create good conditions for short positions, aiming to test support at 1.1117, which we have not managed to break below today. A breakout and consolidation below this range, along with a retest from below to above, will provide another selling point with a move toward 1.1097. The furthest target will be the 1.1074 level, which would entirely invalidate the bulls' plans for further euro growth. I will take profits there. If EUR/USD rises and there are no bears around 1.1150, buyers will continue to build the bullish trend with a chance of testing the resistance at 1.1176. I will also sell there, but only after an unsuccessful consolidation. I plan to open short positions immediately on a rebound from 1.1199, targeting a downward correction of 30-35 points.

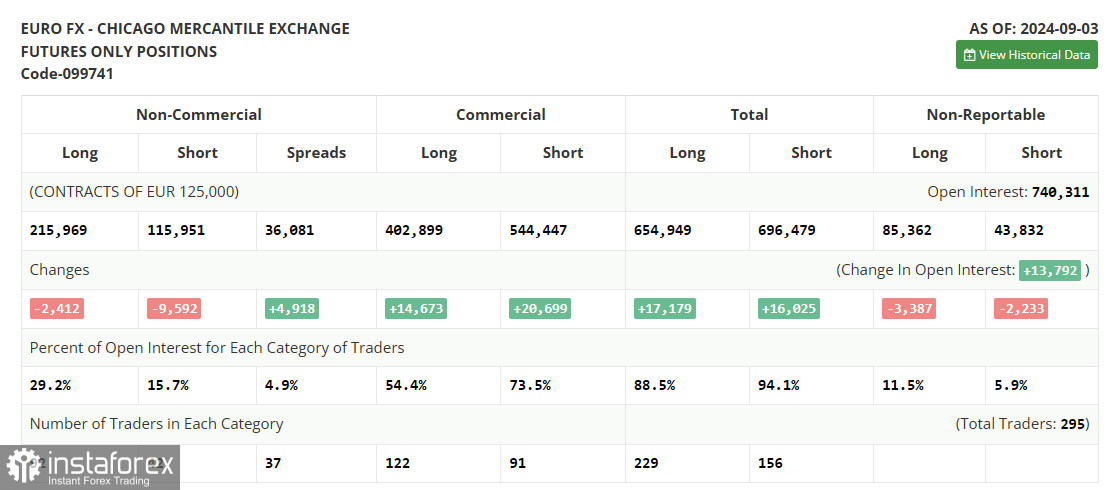
The COT (Commitment of Traders) report from September 3 showed a reduction in both long and short positions. Despite the reduction in euro sellers, this has not affected the pair's bearish technical outlook. The euro will likely continue to lose against the dollar this week, especially with the upcoming European Central Bank meeting, where we'll learn about another interest rate cut in the Eurozone and further monetary policy decisions. However, this does not invalidate the medium-term bullish trend for the euro, and the lower the pair goes, the more attractive it becomes for buying. The COT report indicates that long non-commercial positions decreased by 2,412 to 215,969, while short non-commercial positions dropped by 9,592 to 115,951. As a result, the gap between long and short positions increased by 4,918.
Indicator signals:
Moving averages:
Trading is taking place above the 30- and 50-day moving averages, indicating further growth in the pair.
Note: The period and prices of the moving averages are considered by the author on the hourly H1 chart and differ from the general definition of classic daily moving averages on the D1 daily chart.
Bollinger Bands:
In the event of a decline, the lower boundary of the indicator around 1.1117 will serve as support.
Indicator descriptions:
- Moving average (MA): Determines the current trend by smoothing volatility and noise. Period 50. Marked in yellow on the chart.
- Moving average (MA): Determines the current trend by smoothing volatility and noise. Period 30. Marked in green on the chart.
- MACD indicator (Moving Average Convergence/Divergence): Fast EMA period 12. Slow EMA period 26. SMA period 9.
- Bollinger Bands: Period 20.
- Non-commercial traders: Speculators such as individual traders, hedge funds, and large institutions using the futures market for speculative purposes and meeting specific requirements.
- Long non-commercial positions: Represent the total long open position of non-commercial traders.
- Short non-commercial positions: Represent the total short open position of non-commercial traders.
- Total non-commercial net position: The difference between short and long positions of non-commercial traders.
 English
 Русский
 Bahasa Indonesia
 Bahasa Malay
 ไทย
ไทย Español
 Deutsch
 Български
 Français
 Tiếng Việt
 中文
中文 বাংলা
বাংলা हिन्दी
 Čeština
 Українська
 Română

