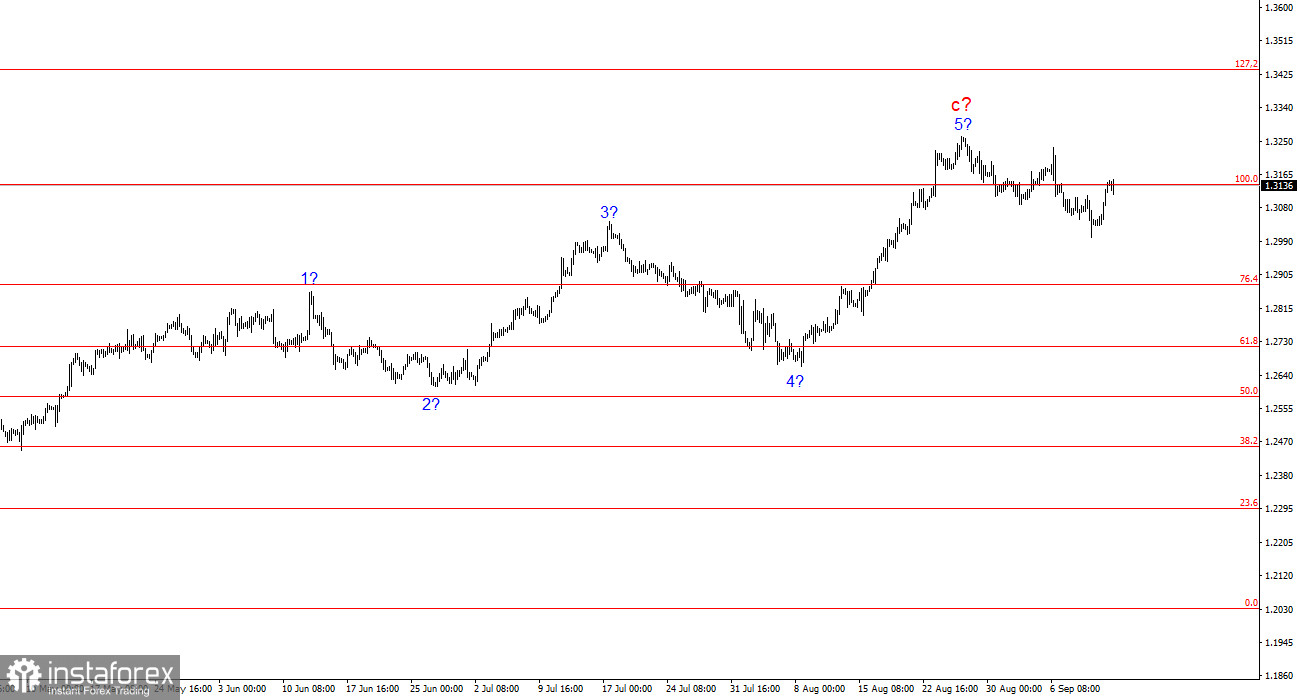
The wave structure for GBP/USD remains intricate and ambiguous. For a while, the wave pattern looked convincing and suggested the formation of a downward wave set with targets below the 23rd figure. However, in practice, demand for the U.S. dollar grew too strongly to realize this scenario, and it continues to grow.
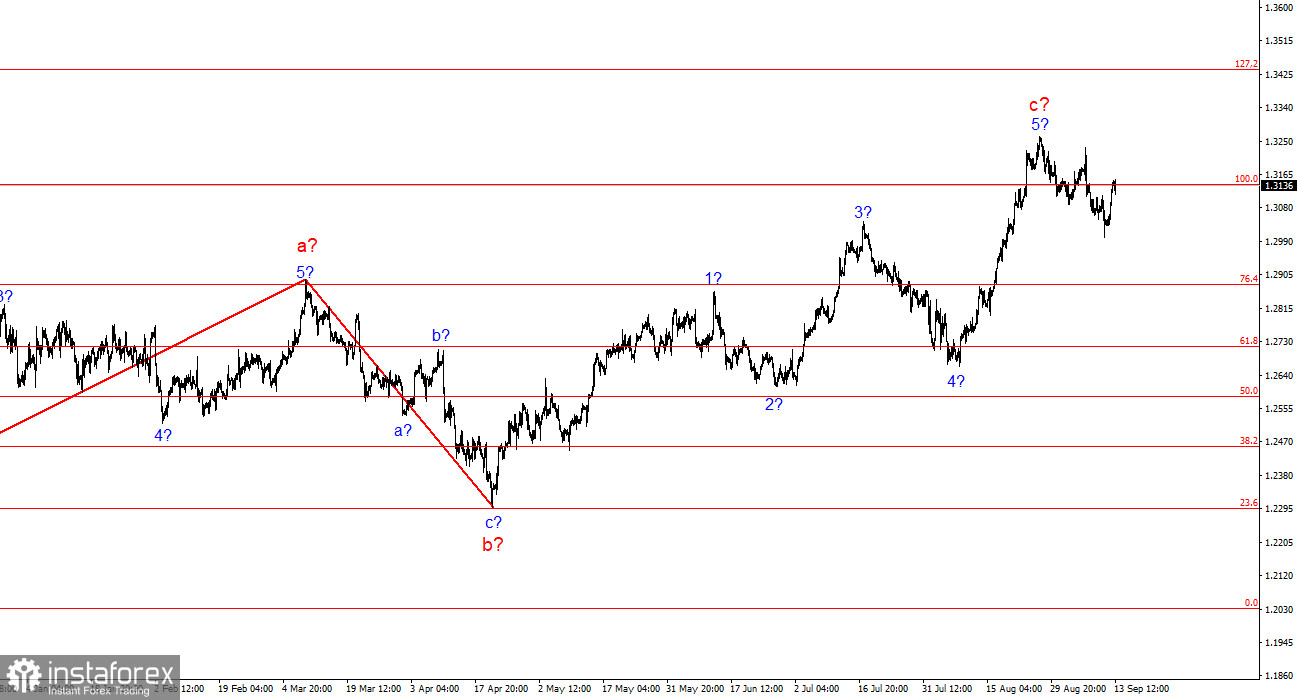
The wave structure has currently become quite complex. I remind you that in my analysis, I try to use simple structures, as complex ones tend to have too many nuances and ambiguities. We are currently witnessing another upward wave, which has caused the pair to break out of the triangle. This current upward wave set, which presumably began around April 22, could extend further, as the market does not appear to be stabilizing until all stages of the Fed's rate cuts have been factored in. Now, a three-wave corrective structure is taking shape again, and a successful breakout of the 1.3142 level, equivalent to 100.0% Fibonacci, indicates the market's readiness for at least a slight decline.
Sellers Withdraw Without Resistance.
The GBP/USD pair rose by 110 basis points during Thursday and Friday. The immediate question is—what caused this movement? Even analysts from major banks cannot provide a clear answer. It's evident that demand for the British currency started rising after the ECB meeting yesterday, though the reason behind this increase following a rate cut in the Eurozone remains unclear. Some analysts suggested today that the British pound is rising ahead of next week's Bank of England meeting, possibly due to the UK regulator pausing its policy easing. But this raises another question: why did the pound begin to rise at the same time as the euro? Could the market not have accounted for this factor at another time?
In my view, such explanations are an attempt to present wishful thinking as reality. Analysts may offer various interpretations, but they remain speculative. As for the pound itself, the upward trend is still intact, and three waves down have formed. Technically, the pair could begin forming a new upward wave set. I believe the current correction is not only insufficient, but it also doesn't align with the wave picture. But if the market consistently increases demand for the pound, where else could the price go? I also note that several important reports were released in the UK this week, which the market largely disregarded. Today, it seems the market is only interested in factors that justify buying the pound.
Conclusions.
The wave structure for GBP/USD still suggests a decline. If the upward trend began on April 22, it has already taken on a five-wave structure. The corrective wave has formed into a three-wave structure, but in my view, it is too small to expect a new upward trend. I still consider selling the pair more attractive, but now signals are needed. A failed attempt to break the 1.3138 level, equivalent to 100.0% Fibonacci, could serve as a bearish signal.
On a larger wave scale, the wave structure has transformed. Now we can anticipate the formation of a complex and extended upward corrective structure. At the moment, it's a three-wave pattern, but it could develop into a five-wave structure, which could take several months or longer to complete.
Key Principles of My Analysis:
- Wave structures should be simple and comprehensible. Complex structures are difficult to trade and often undergo changes.
- If there's uncertainty in the market, it's better not to enter.
- There's never 100% certainty in the direction of movement. Always use Stop Loss orders for protection.
- Wave analysis can be combined with other forms of analysis and trading strategies.
 English
 Русский
 Bahasa Indonesia
 Bahasa Malay
 ไทย
ไทย Español
 Deutsch
 Български
 Français
 Tiếng Việt
 中文
中文 বাংলা
বাংলা हिन्दी
 Čeština
 Українська
 Română


