Analysis of GBP/USD 5M

The GBP/USD pair traded with low volatility and an upward movement on Thursday. The market had no reason to buy the British currency. The rise in quotes on Thursday can be attributed to a correction within a correction within a correction, but we still do not see any excitement around the US currency, which has been falling for two years. In other words, the movement we are currently observing does not resemble the start of a new downward trend that would last at least a year. It seems that the market has slightly corrected and is now preparing for a new wave of baseless purchases. To be precise, these purchases are justified from the market's perspective. However, if we look at the fundamentals and macroeconomics, there is no logic in the growth of the British currency.
The downward trend persists as long as the price remains below the Ichimoku indicator lines and the descending trend line. Perhaps this is the only hope for the US dollar at the moment. After it became known that inflation in America had decreased to 2.5%, the Federal Reserve may lower the rate at each subsequent meeting. If the market has indeed (as we assume) already priced in most of the monetary policy easing, then that's good—the dollar will be saved. If not, then the US dollar faces another prolonged decline. At the same time, the monetary policies of the European Central Bank and the Bank of England do not interest market participants at all.
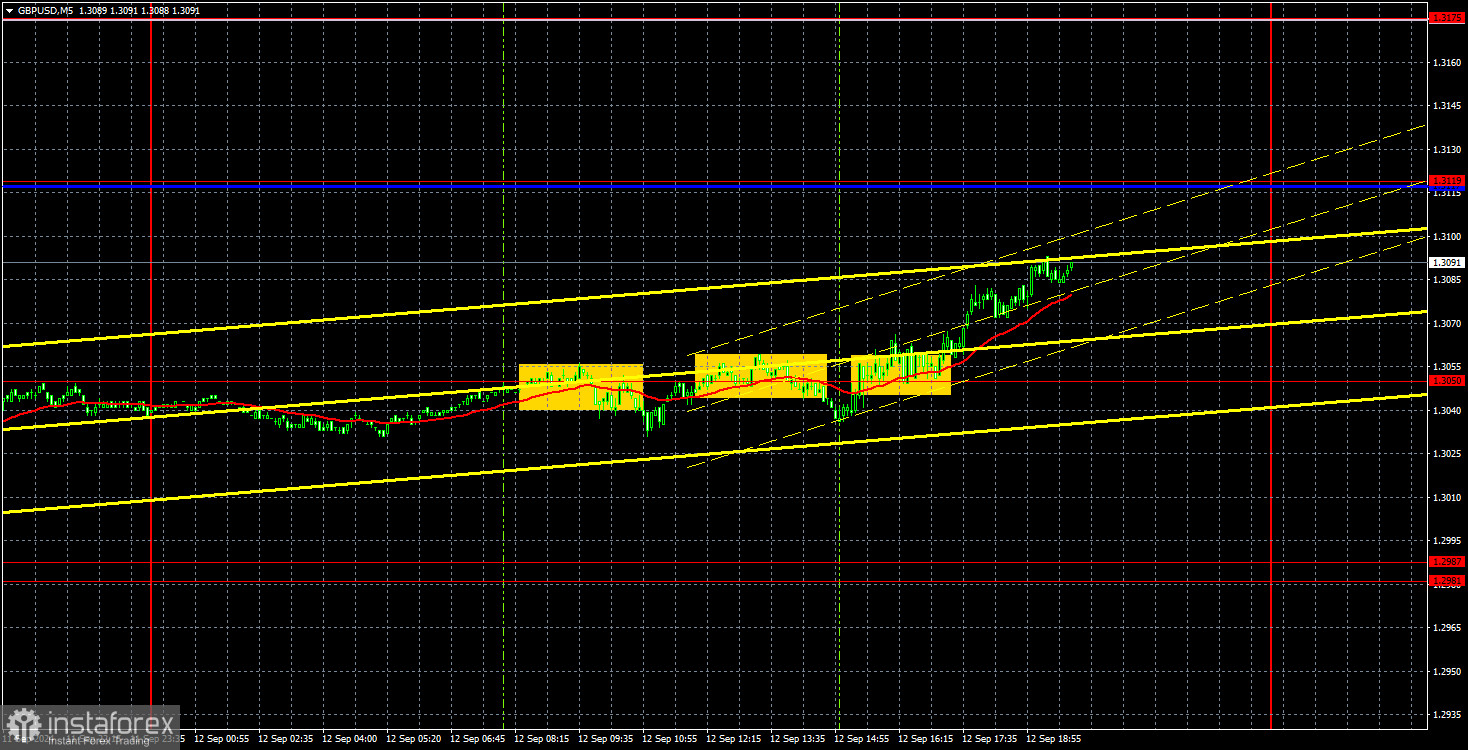
Yesterday, three trading signals were formed. The price bounced off the 1.3050 level twice but could not move down even 20 pips. Then the price consolidated above the 1.3050 level, and we finally saw some movement on which we could earn money. However, the first short position was unprofitable, so overall, it was unlikely to make a profit on Thursday.
COT report:

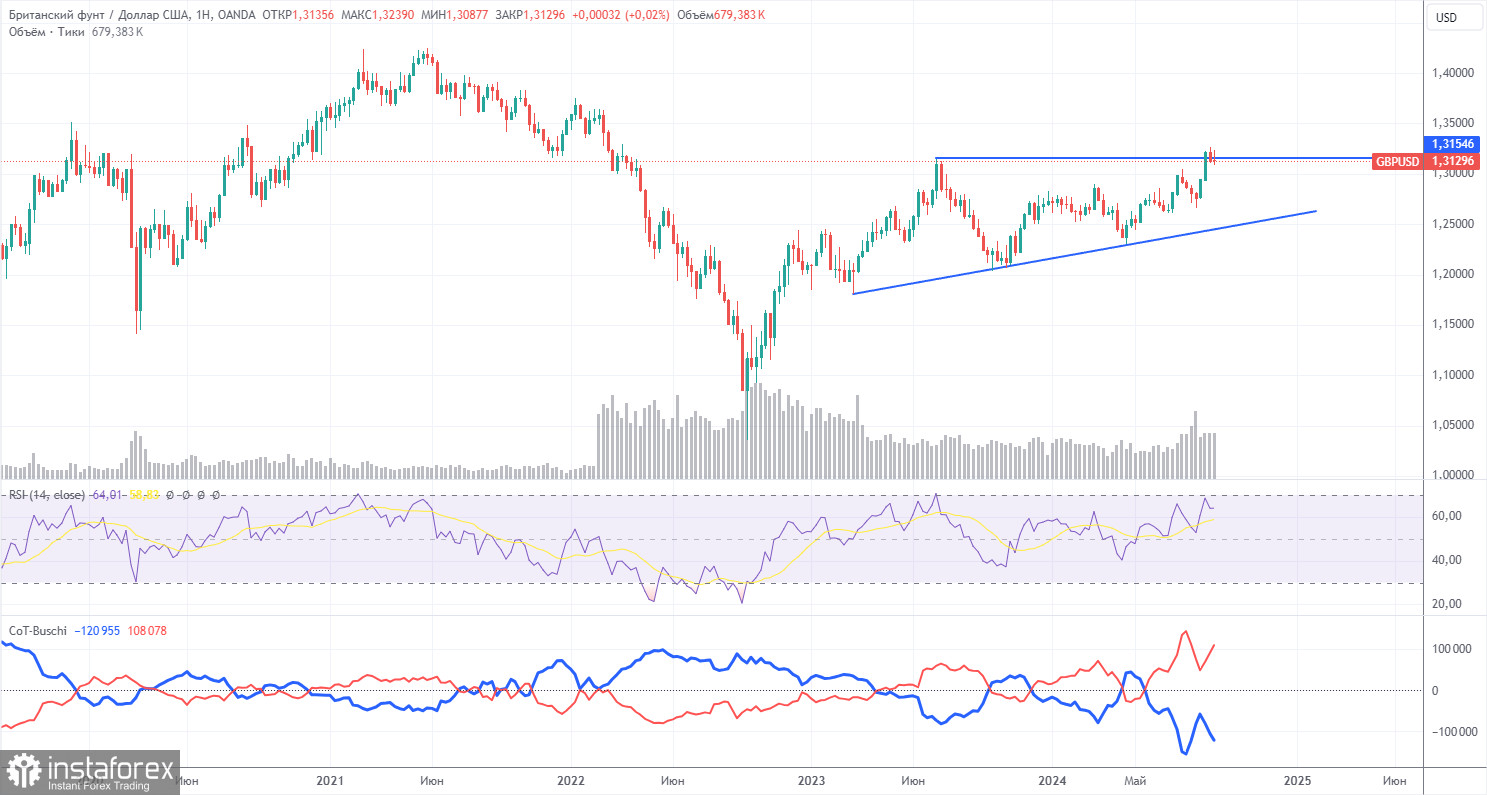
The COT reports for the British pound show that the sentiment of commercial traders has been subject to frequent changes in recent years. The red and blue lines, representing the net positions of commercial and non-commercial traders, constantly intersect and are mainly close to the zero mark. We also see that the last downward trend occurred when the red line was below zero. Therefore, a downturn could be expected around the level of 1.3154, but this assumption will need regular confirmation over time.
According to the latest report on the British pound, the non-commercial group opened 8,600 buy contracts and closed 9,500 short ones. This led to a significant increase in the net position of non-commercial traders by another 18,100 contracts over the week, and overall, it continues to grow.
The fundamental background still does not provide any grounds for long-term purchases of the pound sterling, and the currency has a real chance to resume the global downtrend. However, an ascending trend line formed in the weekly time frame. Therefore, a long-term decline in the pound is unlikely unless the price breaches this trend line. Despite almost everything, the pound continues to rise. Even when COT reports show that major players are selling the pound, it continues to increase.
Analysis of GBP/USD 1H

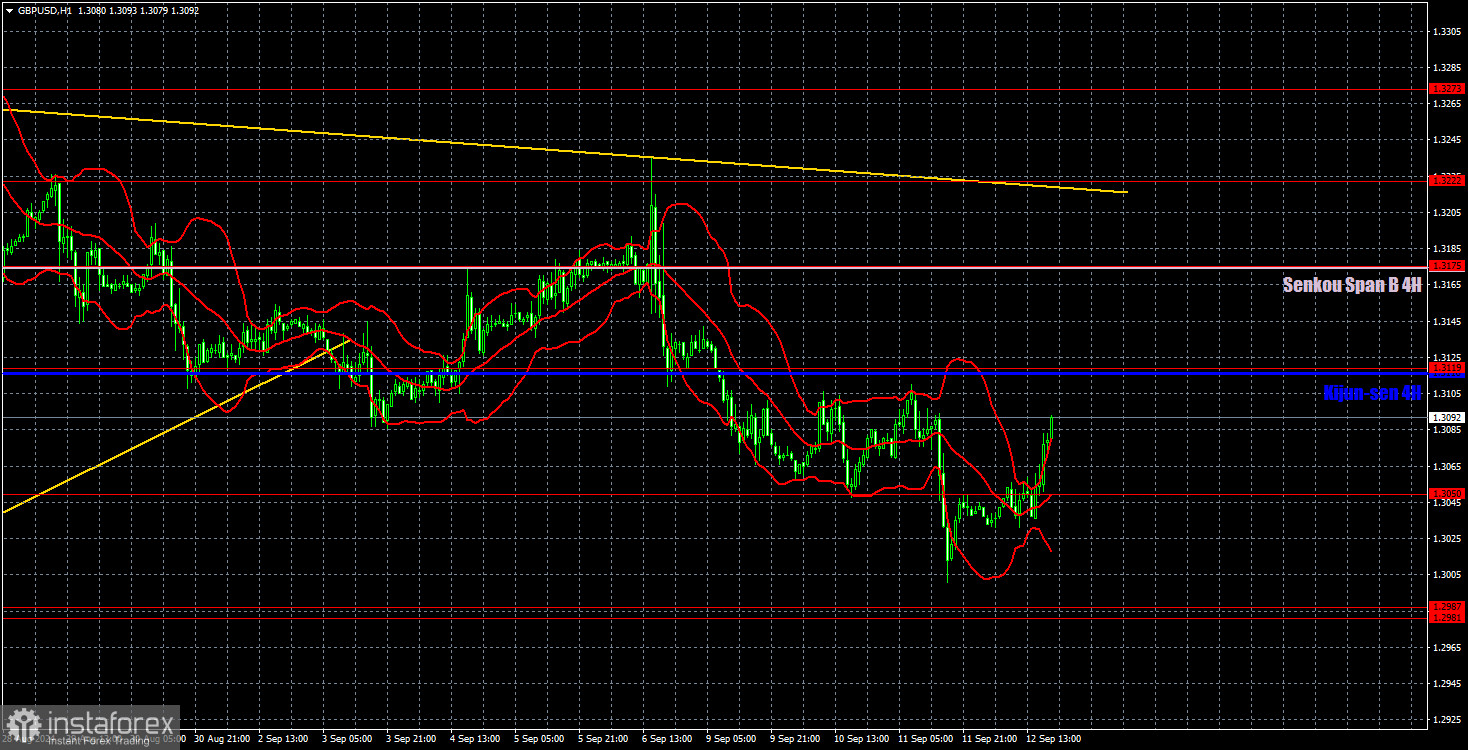
In the hourly time frame, GBP/USD continues to correct, but this correction could end at any moment. We still do not see the market rushing to sell the pair and buy the US dollar. Thus, the baseless and illogical rise of the British currency may resume. This can be identified if the price consolidates above the Senkou Span B and Kijun-sen lines and the trend line.
For September 13, we highlight the following key levels: 1.2605–1.2620, 1.2691–1.2701, 1.2796–1.2816, 1.2863, 1.2981–1.2987, 1.3050, 1.3119, 1.3175, 1.3222, 1.3273, 1.3367. The Senkou Span B line (1.3174) and the Kijun-sen line (1.3116) can also serve as signal sources. Setting the Stop Loss to break even when the price moves in the intended direction by 20 pips is recommended. The Ichimoku indicator lines may shift during the day, which should be considered when determining trading signals.
No interesting events are scheduled in the UK for Friday, but market participants don't need them now. There were quite a few interesting reports from the UK this week, but we didn't see much reaction. The US has a secondary Consumer Sentiment Index from the University of Michigan. Everything suggests that the end of the week will be very dull.
Explanation of illustrations:
Support and resistance levels: Thick red lines near which the trend may end.
Kijun-sen and Senkou Span B lines: These Ichimoku indicator lines, transferred from the 4-hour timeframe to the hourly chart, are strong lines.
Extreme levels: Thin red lines from which the price previously bounced. These provide trading signals.
Yellow lines: Trend lines, trend channels, and other technical patterns.
Indicator 1 on COT charts: The net position size for each category of traders.
 English
 Русский
 Bahasa Indonesia
 Bahasa Malay
 ไทย
ไทย Español
 Deutsch
 Български
 Français
 Tiếng Việt
 中文
中文 বাংলা
বাংলা हिन्दी
 Čeština
 Українська
 Română

