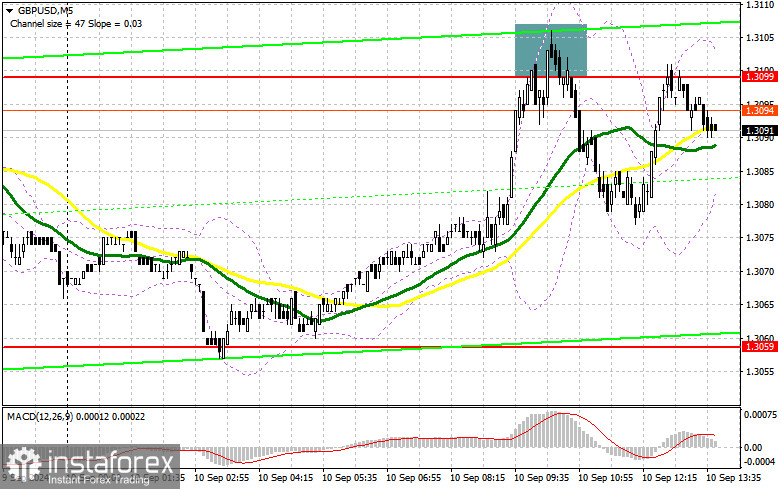
In my morning forecast, I highlighted the level of 1.3099 and planned to make trading decisions based on it. Let's take a look at the 5-minute chart to see what happened. The rise and formation of a false breakout at that level provided a selling opportunity for the pound, resulting in a 20-point drop for the pair. The technical picture for the second half of the day has not changed.

To open long positions on GBP/USD:
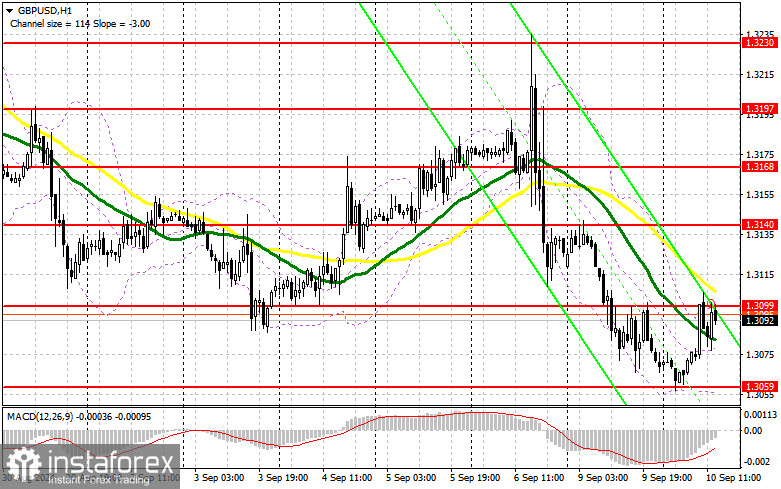
The pound reacted with a slight rise to the labor market data, where the unemployment rate decreased, and the number of jobless claims was lower than economists' forecasts. In the second half of the day, not much is expected to change, as the NFIB Small Business Optimism Index in the US doesn't typically have a major market impact. Buyers will likely continue to defend the 1.3099 level, which could be supported by the speech from FOMC member Michael S. Barr. If there is a negative reaction to his speech, I will only consider returning to long positions after a decline and the formation of a false breakout around the weekly low of 1.3059. This would provide a chance for a correction and a possible recovery back to 1.3099. A breakout and retest from the top down of this range would strengthen the chances of an intraday uptrend. This would trigger stop orders for sellers and offer a good entry point for long positions, targeting 1.3140. The ultimate target would be 1.3168, where I will take profit. If GBP/USD declines and no bullish activity appears around 1.3059 in the second half of the day, pressure on the pair will increase, leading to a drop to the next support at 1.3037, negating buyers' plans. A false breakout there would be the only suitable condition for opening long positions. I plan to buy GBP/USD immediately on a rebound from the 1.3012 low, targeting a 30-35 point correction during the day.
To open short positions on GBP/USD:
Sellers have responded well, but the euphoria from the labor market data is still supporting risk appetite. The main task for the bears remains defending the 1.3099 resistance level. A false breakout at this level, similar to the one I analyzed earlier, will be a valid signal to open new short positions in continuation of the downtrend and target the 1.3059 support. A breakout and retest from the bottom up of this range will hit the buyers' positions, triggering stop orders and opening the way to 1.3037, where I expect more active participation from major players. The ultimate target will be the 1.3012 level, where I will take profit. If GBP/USD rises and there is no bearish activity at 1.3099 in the second half of the day—where the moving averages are already positioned in favor of sellers—buyers will still have a chance to keep the pair locked within a sideways channel. In this case, the bears will likely retreat to the 1.3140 resistance area. I will only sell there after a false breakout. If there is no downward movement from this level, I will look for short positions on a rebound from 1.3168, but only for a 30-35 point correction within the day.

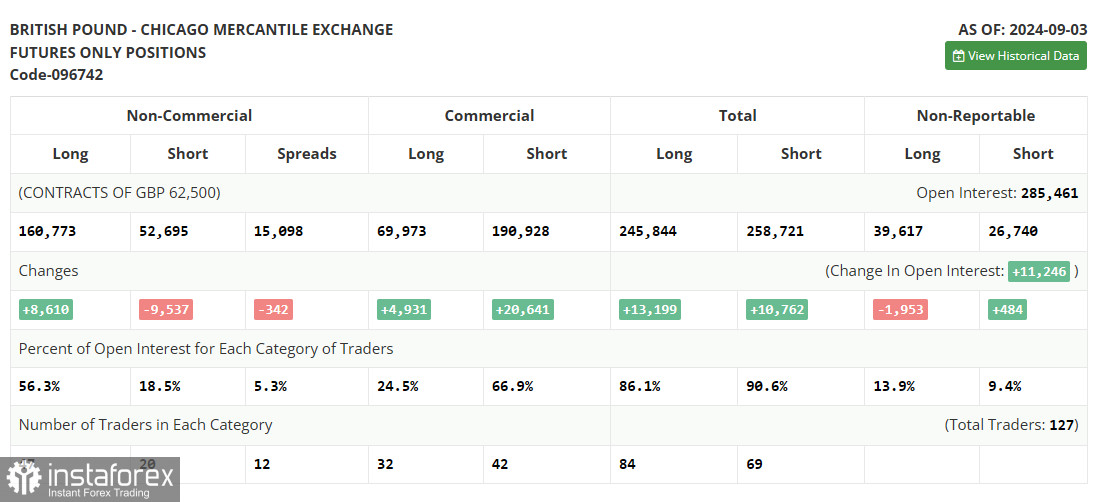
The COT report (Commitment of Traders) for September 3 showed an increase in long positions and a reduction in short positions. Clearly, despite the pair's correction, traders are confident that a U.S. rate cut is a much more significant event than similar actions from the Bank of England. Most likely, the market is currently pricing in a future reduction in borrowing costs in the UK, and demand for the pound is expected to return soon, as the medium-term upward trend remains intact. The lower the pair goes, the more attractive it becomes for new purchases. The ratio of long to short positions, with long positions outnumbering short positions by three to one, speaks for itself. The latest COT report indicated that long non-commercial positions rose by 8,610 to a level of 160,773, while short non-commercial positions decreased by 9,537 to a level of 52,653. As a result, the spread between long and short positions fell by 342.
Indicator Signals:
Moving Averages:
Trading is taking place around the 30 and 50-day moving averages, indicating a sideways market.
Bollinger Bands:
If the pair declines, the lower boundary of the indicator around 1.3059 will serve as support.
Indicator Descriptions:
- Moving Average: Determines the current trend by smoothing volatility and noise. Period 50. Marked in yellow on the chart.
- Moving Average: Determines the current trend by smoothing volatility and noise. Period 30. Marked in green on the chart.
- MACD Indicator (Moving Average Convergence/Divergence): Fast EMA period 12. Slow EMA period 26. SMA period 9.
- Bollinger Bands: Period 20.
- Non-commercial traders: Speculators such as individual traders, hedge funds, and large institutions using the futures market for speculative purposes.
- Long non-commercial positions: Represent the total long open positions held by non-commercial traders.
- Short non-commercial positions: Represent the total short open positions held by non-commercial traders.
- Total non-commercial net position: The difference between long and short positions held by non-commercial traders.
 English
 Русский
 Bahasa Indonesia
 Bahasa Malay
 ไทย
ไทย Español
 Deutsch
 Български
 Français
 Tiếng Việt
 中文
中文 বাংলা
বাংলা हिन्दी
 Čeština
 Українська
 Română

