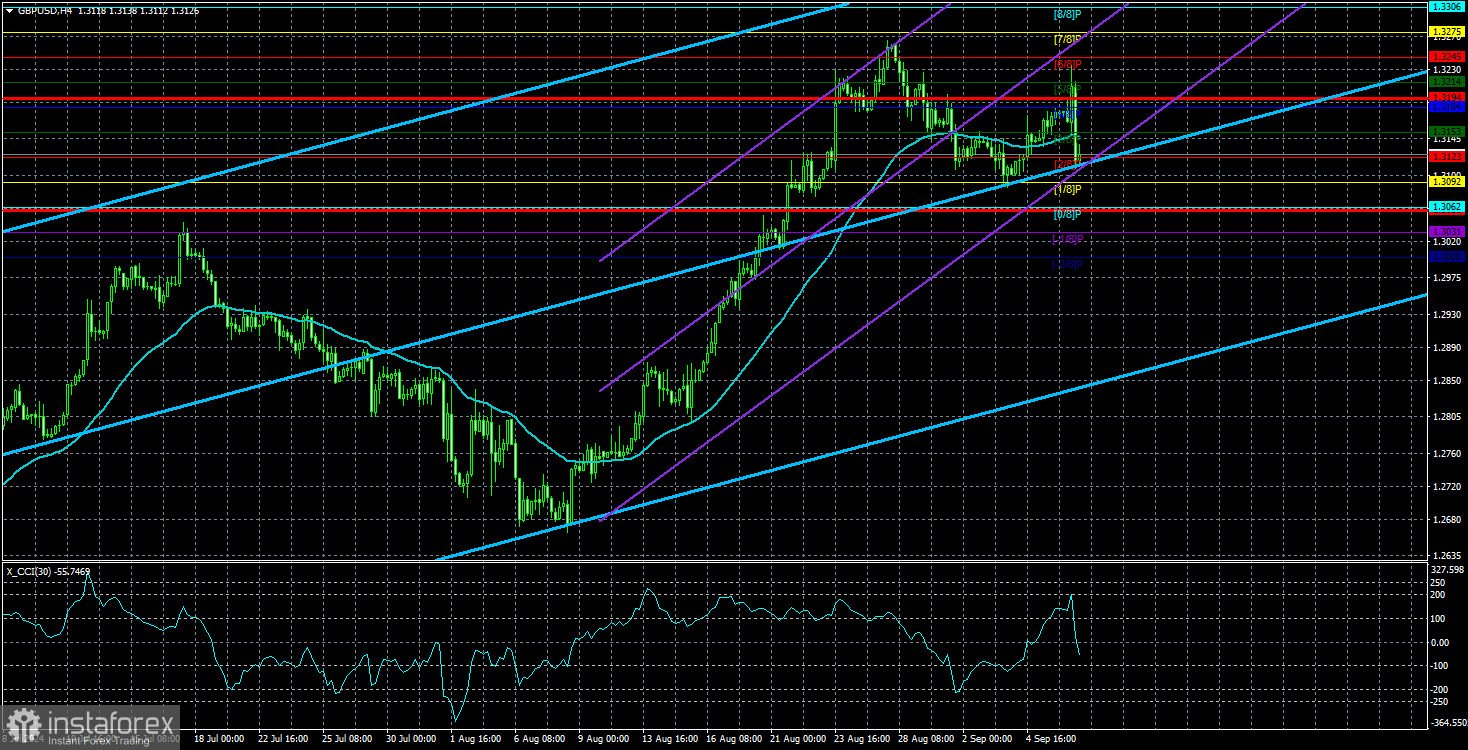
The GBP/USD pair also traded lower on Friday. The price again consolidated below the moving average line, suggesting the expectation of further decline. However, even in the 4-hour time frame, it is visible that the British pound is still in no hurry to correct. In other words, the British currency is not falling, period. Friday only showed a slight decrease, which could have been non-existent. Three important reports published in the U.S. could have easily triggered the opposite market reaction. Recall that the unemployment rate, although it decreased, did so within the forecast so effectively that there was nothing for the market to react to. The number of Nonfarm Payrolls again came below forecasts, and the July figure was revised downward. The average hourly earnings rose by 3.8%, almost corresponding to forecasts.
However, the dollar has risen in price purely formally. It may resume its decline this week, as inflation in the U.S. could slow down to levels that allow the Federal Reserve to begin easing monetary policy without hesitation. If there was talk of 1-2 rate cuts in favor of the labor market a week ago, now both the labor market will demand policy easing, and inflation will allow the rate to be lowered. Consequently, the Fed (if inflation drops to 2.6% or lower) could indeed reduce the key rate at all three meetings by the end of the year. Whether the market has already priced in the entire easing cycle, and if not, how many stages of easing it has already accounted for, is challenging to answer, but it is precisely this that will allow us to understand when the pound's perpetual rise will end.
And what about the United Kingdom? This week, a series of interesting reports will be released in Great Britain. On Tuesday, the unemployment rate and average earnings will be published. On Wednesday, monthly and three-month GDP and industrial production will be released. These are not the most crucial reports for the GBP/USD pair under the current circumstances, but they can locally affect its movement. The market still pays much more attention to macroeconomic data from the U.S. and the prospects of the Fed's monetary policy. The monetary policy of the Bank of England is not of particular interest. The British central bank began easing earlier than the American one and may also lower the key rate this month. However, only the U.S. dollar is falling.
An upward trend is clearly visible in the daily time frame, but in the weekly time frame, it is also evident that this entire trend is a correction against a stronger downward trend. Recall that the British pound is in a global 16-year downtrend. Given that the UK economy is in no better shape than the U.S., and the market has been pricing in the easing of the Fed's monetary policy for two years, which has not even started yet, we do not see what could sustain the pound's growth in the next year or two. We did not expect the pair's growth to continue over the past few months, but in any case, we cannot forecast further growth of the British currency.

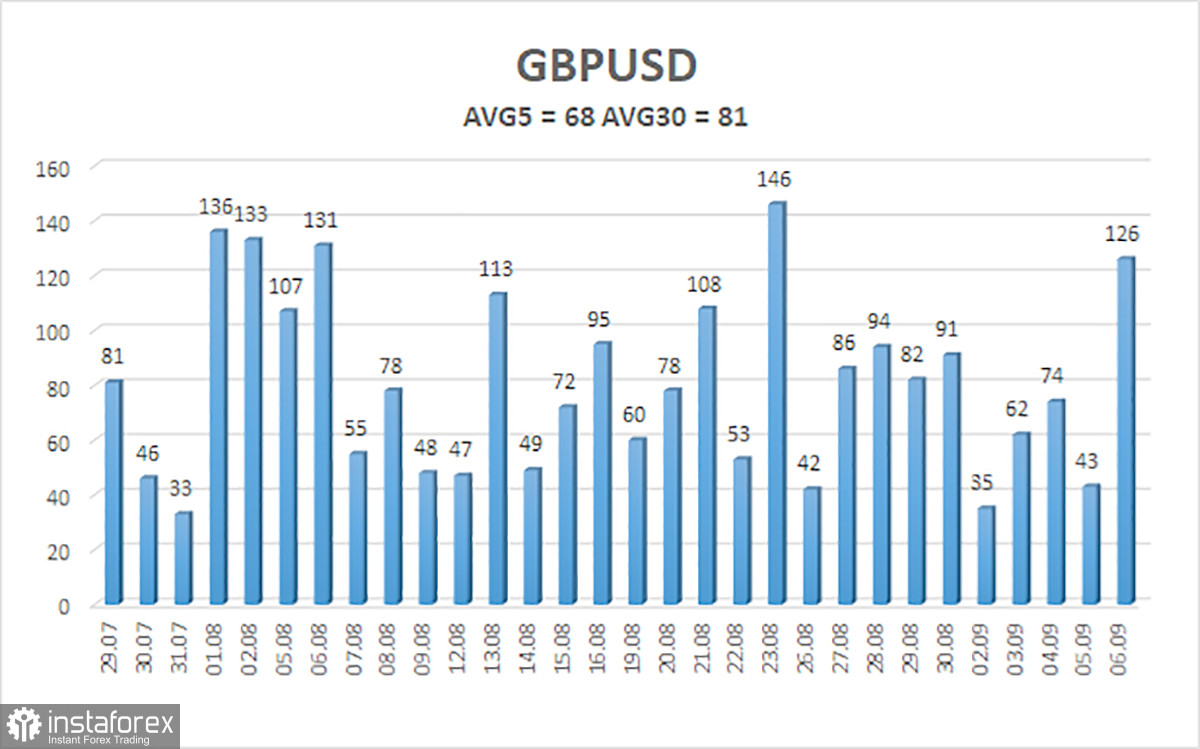
The average volatility of the GBP/USD pair over the past five trading days is 68 pips, which is considered average for this pair. Therefore, on Monday, September 9, we expect movement within a range bounded by levels 1.3058 and 1.3194. The upper linear regression channel is directed upwards, signaling the continuation of the upward trend. The CCI indicator has formed its fourth bearish divergence, suggesting a significant drop.
Nearest Support Levels:
- S1 – 1.3123
- S2 – 1.3092
- S3 – 1.3062
Nearest Resistance Levels:
- R1 – 1.3153
- R2 – 1.3184
- R3 – 1.3214
Trading Recommendations:
The GBP/USD pair has taken the first step towards a downtrend, but this step may remain the only one. We are not considering long positions now, as we believe that the market has repeatedly factored in all the bullish factors for the British currency (which are not much). Short positions can be considered with targets at 1.2939 and 1.2878, as the price has once again consolidated below the moving average. However, last week's macroeconomic data from the U.S. again created pressure on the dollar, and the market may well continue to work on easing the Fed's monetary policy in the near future.
Explanations for Illustrations:
Linear Regression Channels: help determine the current trend. If both are directed in the same direction, it means the trend is strong at the moment.
Moving Average Line (settings 20,0, smoothed): defines the short-term trend and the direction in which trading should be conducted.
Murray Levels: target levels for movements and corrections.
Volatility Levels (red lines): the probable price channel in which the pair will spend the next 24 hours, based on current volatility indicators.
CCI Indicator: Entering the oversold area (below -250) or the overbought area (above +250) means a trend reversal in the opposite direction is approaching.
 English
 Русский
 Bahasa Indonesia
 Bahasa Malay
 ไทย
ไทย Español
 Deutsch
 Български
 Français
 Tiếng Việt
 中文
中文 বাংলা
বাংলা हिन्दी
 Čeština
 Українська
 Română

