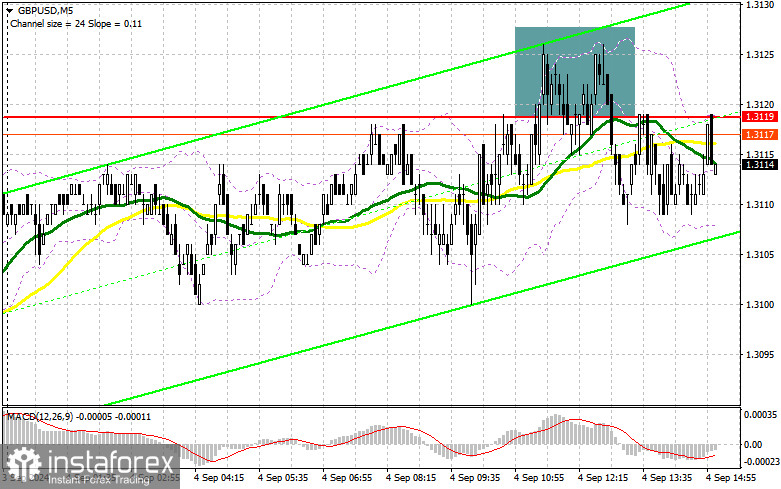
In my morning forecast, I highlighted the level of 1.3119 and planned to make trading decisions based on it. Let's take a look at the 5-minute chart and analyze what happened. The rise and formation of a false breakout near 1.3119 created a selling opportunity for the pound, but the pair only dropped by 10 points. The technical outlook for the second half of the day has been revised.

For opening long positions on GBP/USD:
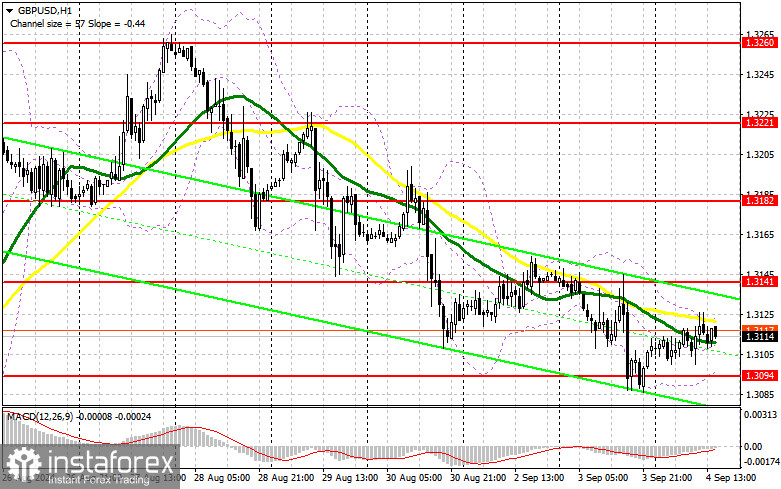
Activity in the UK services sector remains one of the driving forces of the economy, but since the figures matched economists' expectations, it didn't provide much help to pound buyers in the first half of the day. Now, attention should be focused on U.S. trade balance data, job openings and labor turnover (JOLTS), and changes in factory orders. Only particularly weak data is likely to bring buyers back to the market. I plan to act on a reversal after a false breakout near the new support at 1.3094. This will provide a long entry point, aiming for a return to 1.3141, which we didn't quite reach in the first half of the day. A breakout above and a retest of this level will strengthen the chances of an upward trend, potentially triggering sellers' stop orders and enabling a rise toward 1.3182. The farthest target would be 1.3221, where I will take profits. If GBP/USD declines further and there's no buyer activity around 1.3094 in the second half of the day, pressure on the pair will increase. This could also lead to a drop and a retest of the next support at 1.3051. Only a false breakout at this level will provide a suitable condition for opening long positions. I plan to buy GBP/USD on a rebound from the 1.3012 low, targeting a 30-35 point correction within the day.
For opening short positions on GBP/USD:
Sellers remain active, but their efforts haven't significantly impacted the technical picture in the first half of the day. Only strong U.S. economic data is likely to bring major players back to the market. In case of weak statistics, the main task for the bears will be to defend resistance at 1.3141, where a false breakout would provide a good opportunity to open new short positions against the trend, aiming for a correction and a retest of support at 1.3094. A breakout and retest from below will undermine buyers' positions, leading to stop order removal and opening the way to 1.3051, where I expect more active participation from larger players. A test of this level would weaken the pound's bullish momentum. The farthest target will be the 1.3005 level, where I will take profits. If GBP/USD rises and there's no activity around 1.3141 in the second half of the day, buyers will regain control. In that case, bears may need to retreat to the 1.3182 resistance area. I will only sell there after a false breakout. If no decline occurs at that level, I'll look for short positions on a rebound around 1.3221, targeting a 30-35 point downward correction within the day.
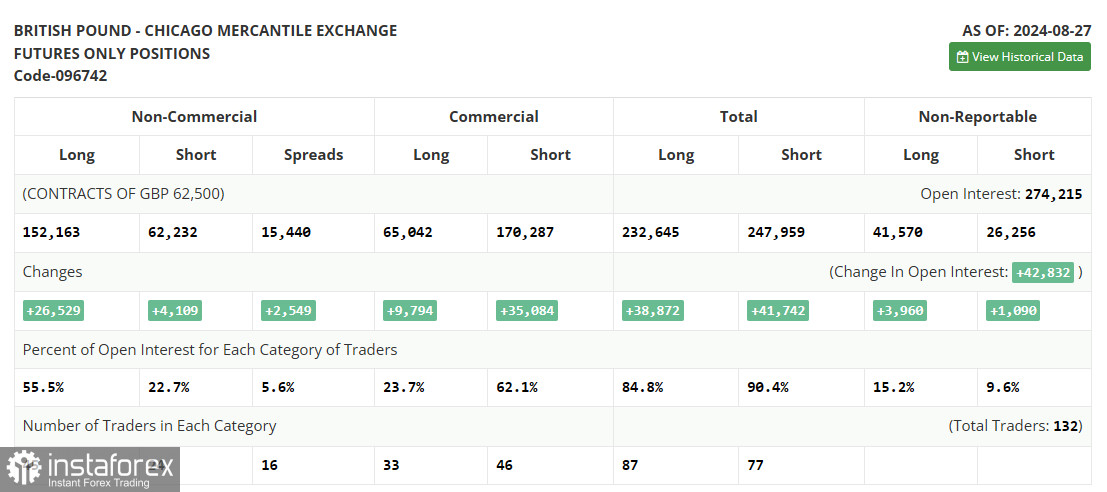
In the Commitment of Traders (COT) report for August 27, there was a sharp increase in long positions and a slight rise in short positions. Traders are confident that the interest rate cuts in the U.S. are a far more significant event than similar actions by the Bank of England, which is why the balance of power in the market continues to shift towards buyers of the British pound, whose numbers have been steadily growing recently. This week, a lot of important U.S. statistics will be released, which could further weaken the dollar's position and restore a bullish trend for the GBP/USD pair. Reports related to the labor market will be of particular importance. The latest COT report shows that long non-commercial positions jumped by 26,529 to a level of 152,163, while short non-commercial positions increased by 4,109 to a level of 62,323. As a result, the gap between long and short positions grew by 2,549.

Signals from Indicators:
Moving Averages:
Trading is occurring around the 30 and 50-period moving averages, indicating a sideways market.
Note: The period and prices for moving averages are considered on the H1 hourly chart and differ from the general definition of classic daily moving averages on the D1 daily chart.
Bollinger Bands:
In the event of a decline, the lower boundary of the indicator around 1.3094 will act as support.
Indicator Descriptions:
- Moving Average: Defines the current trend by smoothing volatility and noise. Period – 50. Marked in yellow on the chart.
- Moving Average: Defines the current trend by smoothing volatility and noise. Period – 30. Marked in green on the chart.
- MACD Indicator (Moving Average Convergence/Divergence): Fast EMA period – 12. Slow EMA period – 26. SMA period – 9.
- Bollinger Bands: Period – 20.
- Non-commercial traders: Speculators such as individual traders, hedge funds, and large institutions using the futures market for speculative purposes.
- Long non-commercial positions: Represents the total long open positions of non-commercial traders.
- Short non-commercial positions: Represents the total short open positions of non-commercial traders.
- Net non-commercial position: The difference between short and long positions of non-commercial traders.
 English
 Русский
 Bahasa Indonesia
 Bahasa Malay
 ไทย
ไทย Español
 Deutsch
 Български
 Français
 Tiếng Việt
 中文
中文 বাংলা
বাংলা हिन्दी
 Čeština
 Українська
 Română

