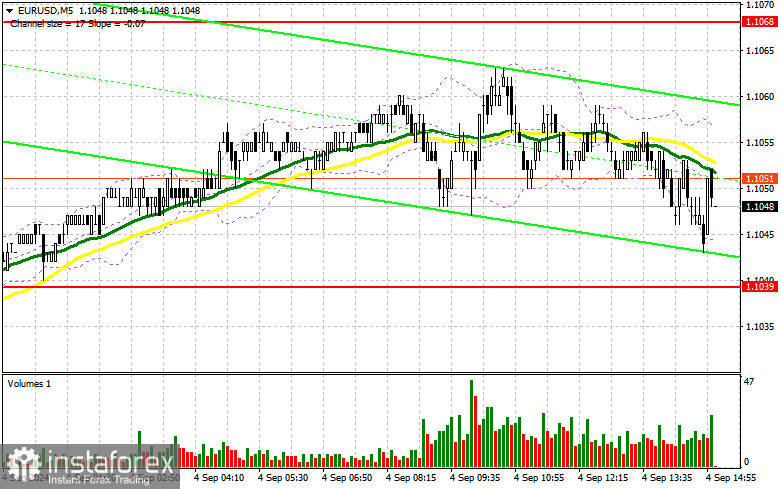
In my morning forecast, I highlighted the level of 1.1039 and planned to base my trading decisions on it. Let's look at the 5-minute chart and break down what happened. A decline occurred, but it didn't quite reach the test or false breakout of 1.1039, so no suitable entry points were found. The technical outlook for the second half of the day remains unchanged.

For opening long positions on EUR/USD:
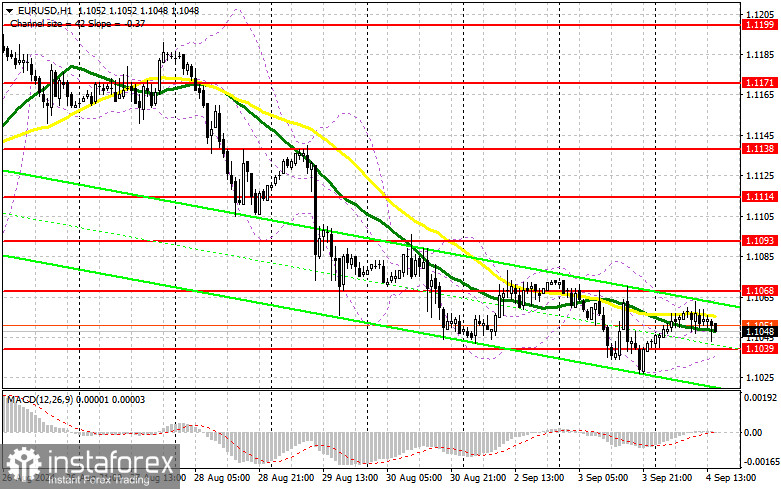
The disappointing PMI service activity data from Eurozone countries put pressure on the euro in the first half of the day. These weak statistics further emphasize the need for interest rate cuts in the eurozone, as without them, the economy could quickly lose momentum for further growth. In the second half of the day, focus should shift to U.S. trade balance data, the Job Openings and Labor Turnover Survey (JOLTS), and factory order volumes. If the data is strong, it will likely trigger further euro selling. Therefore, I'm not rushing into buying. A suitable entry point for long positions may emerge if there is a false breakout around 1.1039, with the target being a recovery towards new resistance at 1.1068, just below the moving averages, which currently favor sellers. A breakout and a retest of this range from above could lead to further growth, potentially testing 1.1093. The furthest target would be the high at 1.1114, where I will take profits. If EUR/USD declines further without buyer activity around 1.1039 in the second half of the day, sellers could strengthen their positions, leading to a larger drop in the pair. In that case, I'll consider entering long positions only after a false breakout around the next support at 1.1011. Alternatively, I'll open long positions on a rebound from 1.0984, targeting an upward correction of 30-35 points within the day.
For opening short positions on EUR/USD:
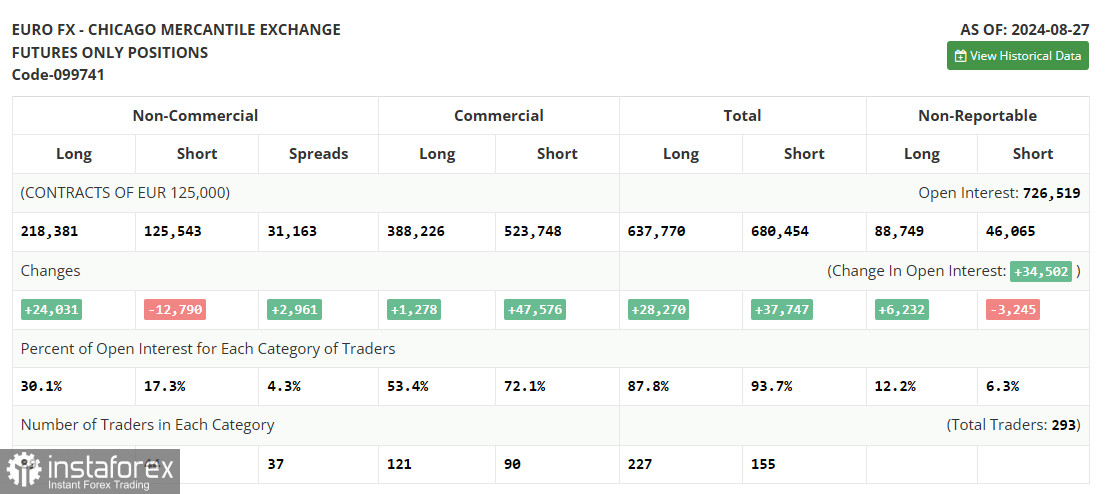
Sellers gained some ground following weak European statistics, but they didn't receive significant support from major players. Before targeting a breakout of 1.1039, it would be wise to wait for U.S. data, as weak results might attract new buyers of risk assets. In that scenario, the bears' primary task would be to defend the 1.1068 level. A false breakout there would provide a good opportunity for short positions, targeting a retest of the support at 1.1039, where I expect an initial buyer reaction. A breakout and consolidation below this level, followed by a retest from below, will offer another selling opportunity, aiming for 1.1011. The furthest target would be the 1.0984 level, where I will take profits. If EUR/USD moves upward and bears fail to show activity around 1.1068, buyers could regain the initiative and push towards resistance at 1.1093. I'll also consider selling at that level, but only after a failed breakout. I plan to open short positions on a rebound from 1.1114, targeting a downward correction of 30-35 points. In the Commitment of Traders (COT) report for August 27, there was an increase in long positions and a significant reduction in short positions. This indicates the continuation of bullish sentiment among buyers of risk assets, which only strengthened after the speech by Federal Reserve Chairman Jerome Powell at Jackson Hole, where he clearly suggested that U.S. interest rates would be lowered in September of this year. The current report reflects the market's full reaction to those statements. The future direction of the dollar will depend entirely on incoming data related to the labor market and inflation, so I recommend paying special attention to these indicators. The COT report shows that non-commercial long positions increased by 24,031 to a level of 218,381, while short non-commercial positions fell by 12,790 to a level of 125,543. As a result, the gap between long and short positions increased by 2,961.

Signals from Indicators:
Moving Averages:
Trading is currently taking place around the 30 and 50-period moving averages, indicating market indecision and uncertainty.
Note: The period and prices for moving averages are considered on the H1 hourly chart and differ from the general definition of classic daily moving averages on the D1 daily chart.
Bollinger Bands:
In the event of a decline, the lower boundary of the indicator around 1.1035 will act as support.
Indicator Descriptions:
- Moving Average: Defines the current trend by smoothing volatility and noise. Period – 50. Marked in yellow on the chart.
- Moving Average: Defines the current trend by smoothing volatility and noise. Period – 30. Marked in green on the chart.
- MACD Indicator (Moving Average Convergence/Divergence): Fast EMA period – 12. Slow EMA period – 26. SMA period – 9.
- Bollinger Bands: Period – 20.
- Non-commercial traders: Speculators such as individual traders, hedge funds, and large institutions using the futures market for speculative purposes and meeting specific criteria.
- Long non-commercial positions: Represents the total long open positions of non-commercial traders.
- Short non-commercial positions: Represents the total short open positions of non-commercial traders.
- Net non-commercial position: The difference between short and long positions of non-commercial traders.
 English
 Русский
 Bahasa Indonesia
 Bahasa Malay
 ไทย
ไทย Español
 Deutsch
 Български
 Français
 Tiếng Việt
 中文
中文 বাংলা
বাংলা हिन्दी
 Čeština
 Українська
 Română

