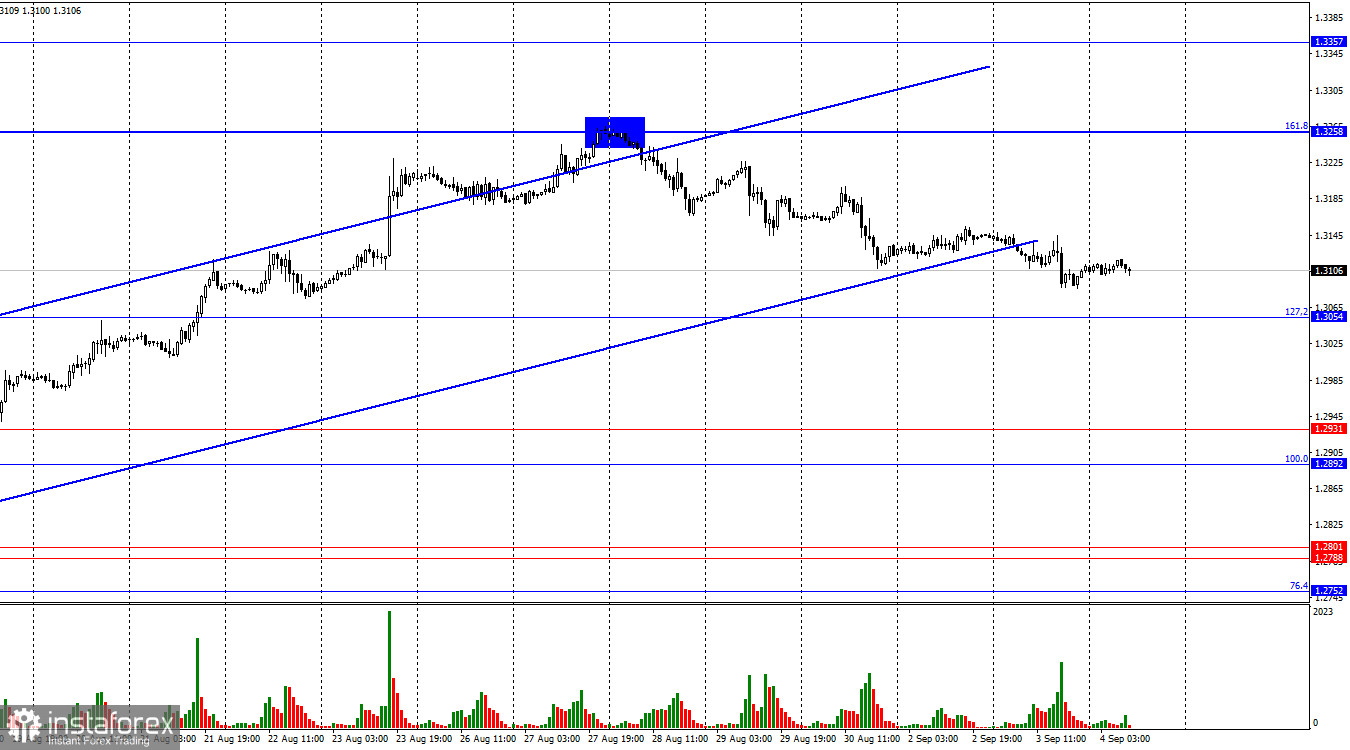
On the hourly chart, the GBP/USD pair continued a weak decline towards the retracement level of 127.2% – 1.3054, which began after rebounding from the 1.3258 level. The intensity of the bearish traders' actions suggests the market's strong demand for the dollar. A rebound from the 1.3054 level will favor the pound and lead to some growth towards the 1.3258 level. A break beneath the 1.3054 level will increase the likelihood of a further drop towards the next level at 1.2931. A break below the upward trend channel would marginally improve the dollar's prospects.

The wave structure raises no concerns. The last completed downward wave failed to break below the low of the previous wave, while the last upward wave managed to break the peak of the previous one. Therefore, we are currently in a clear bullish trend, although the waves are so large that identifying a potential trend reversal will require considerable time. I do not see any internal wave structures to rely on for a trend reversal.
On Tuesday, the fundamental data provided little support for the dollar. One business activity index was relatively positive, while the other was negative. As a result, the dollar gained 30 points during the day, but that's not significant. Today's focus is on the JOLTS report, which is not expected to trigger a significant market move. However, there are no other major data or events at the moment. The market is cautious about selling the pair since it does not expect the Bank of England to cut rates in September but eagerly anticipates monetary easing from the Federal Reserve at all three remaining meetings in 2024. Therefore, if the U.S. labor market and unemployment data later this week do not dissuade the market from these expectations, the pair's decline may not last long. Currently, the dollar lacks sufficient fundamental support to sustain its rise.

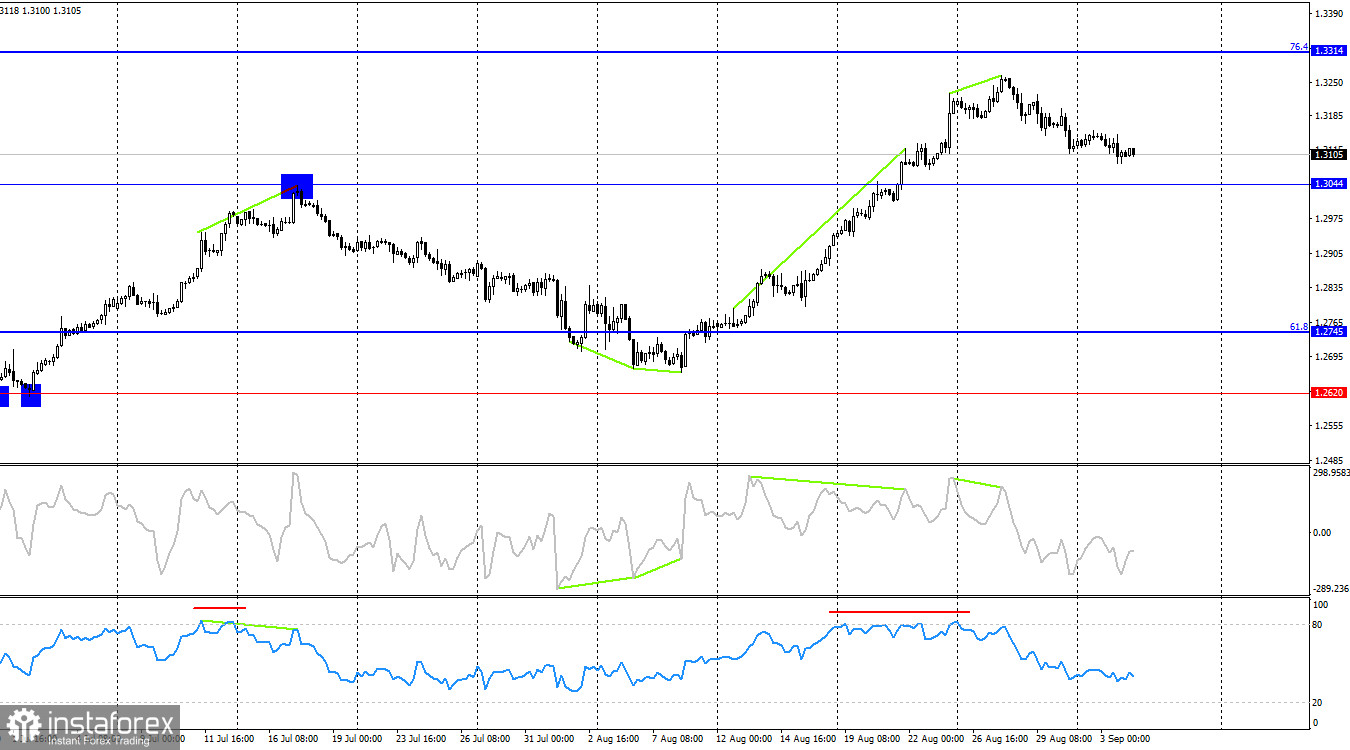
On the 4-hour chart, the pair has consolidated above the 1.3044 level. However, the CCI indicator had been signaling a "bearish" divergence for over a week, and the RSI indicator had been in overbought territory for a week, which is uncommon. As a result, a reversal in favor of the U.S. dollar occurred, and the pair started to fall toward the 1.3044 level. A rebound from this level may lead to a renewed rise toward the retracement level of 76.4% at 1.3314.
Commitments of Traders (COT) Report:

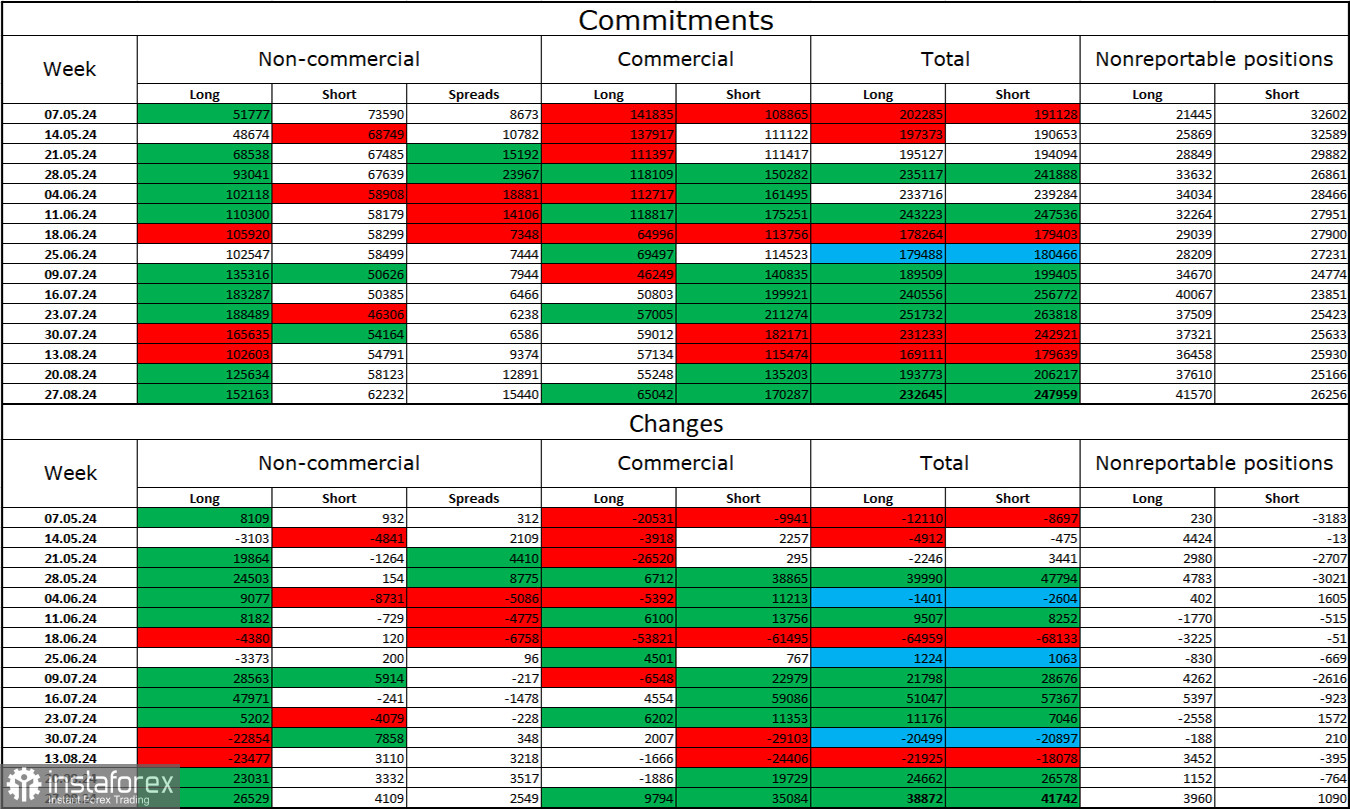
The sentiment among "Non-commercial" traders became significantly more bullish during the last reporting week. The number of long positions held by speculators increased by 26,529, while the number of short positions rose by 4,109. Bulls still hold a strong advantage. The gap between long and short positions is nearly 90,000: 152,000 vs. 62,000.
In my opinion, the British pound still has downward potential, but the COT reports currently suggest otherwise. Over the last three months, the number of long positions has increased from 51,000 to 152,000, while short positions have decreased from 74,000 to 62,000. I believe that, over time, professional players will begin to unwind long positions or increase short positions, as the factors supporting the pound have already played out. However, this is purely speculative. Technical analysis suggests a likely decline in the near future, but the clear bullish trend remains intact for now.
Economic Calendar for the U.S. and the UK:
- UK – Services PMI (08:30 UTC)
- U.S. – JOLTS Job Openings (14:00 UTC)
On Wednesday, the economic calendar includes two significant releases. The fundamental backdrop may influence market sentiment, particularly in the second half of the day.
Forecast for GBP/USD and Trading Advice:
Selling the pair was possible after a rebound from the 1.3258 level on the hourly chart, targeting 1.3054. These trades can still be held. I would not rush to buy until the 1.3054 level is tested.
Fibonacci retracement levels are plotted between 1.2892 and 1.2298 on the hourly chart and between 1.4248 and 1.0404 on the 4-hour chart.
 English
 Русский
 Bahasa Indonesia
 Bahasa Malay
 ไทย
ไทย Español
 Deutsch
 Български
 Français
 Tiếng Việt
 中文
中文 বাংলা
বাংলা हिन्दी
 Čeština
 Українська
 Română

