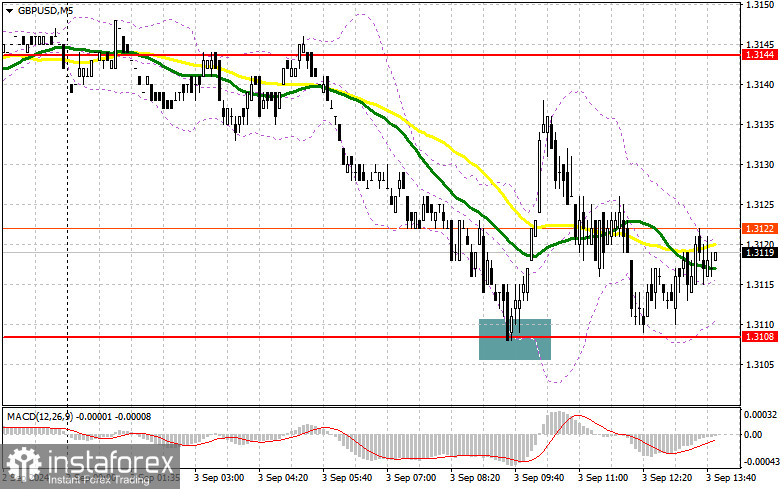
In my morning forecast, I focused on the 1.3108 level and planned to make trading decisions based on it. Let's review the 5-minute chart to see what happened. The decline and formation of a false breakout at 1.3108 led to a buy signal for the pound and a 30-point upward movement in the pair. The technical outlook for the second half of the day remained unchanged.

For opening long positions on GBP/USD:
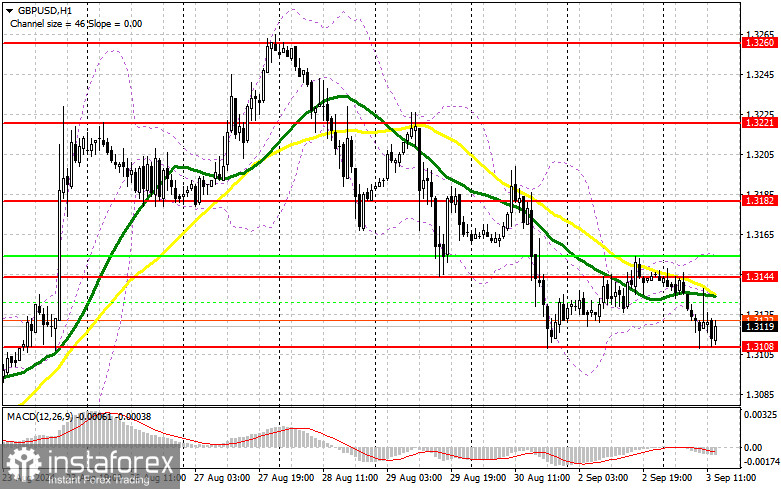
The absence of data from the UK likely spared the British pound from a new sell-off. Now, much will depend on U.S. data. Expected figures include the U.S. manufacturing index and the ISM manufacturing index. Strong data indicating growth could lead to another pound sell-off, potentially breaking 1.3108. A false breakout in this range, similar to what I discussed above, will provide an entry point for long positions with the expectation of a return to 1.3144, where the moving averages are currently aligned with the sellers. A breakout followed by a confirmation of support at this range will strengthen the chances of an upward trend, potentially pushing the pair to 1.3182. The furthest target will be the 1.3221 level, where I will take profit. If GBP/USD declines further and there is a lack of bullish activity at 1.3108 in the afternoon, pressure on the pair will increase. This will likely result in a drop to and a test of the next support level at 1.3077. Only a false breakout will be a suitable condition for opening long positions. I plan to buy GBP/USD on a rebound from the 1.3037 low, targeting a 30-35 point intraday correction.
For opening short positions on GBP/USD:
Sellers remain active, but they seem to lack momentum, which could be influenced by upcoming U.S. manufacturing data. If the statistics are poor, considering the current challenges in the U.S. manufacturing sector, the pound might strengthen. In such a scenario, the main task for bears will be to defend the 1.3144 resistance level, where a false breakout will be an acceptable condition for opening new short positions against the trend, with the target of correcting and updating the support level at 1.3108. A breakout and a subsequent upward test of this range will hit buyers' positions, leading to a stop-loss trigger and opening the path to 1.3077, where I expect more active actions from major players. The furthest target will be the 1.3005 level, where I will take profit. Testing this level could signal the beginning of a new bearish trend for the pair. If GBP/USD rises and bearish pressure at 1.3144 is absent in the afternoon, buyers may regain control. Therefore, bears will have no choice but to retreat to the 1.3182 resistance area. I will consider selling only if there is a false breakout at that level. If there is no downward movement and no significant short positions, I will look for rebound opportunities around 1.3221, targeting a 30-35 point intraday correction.
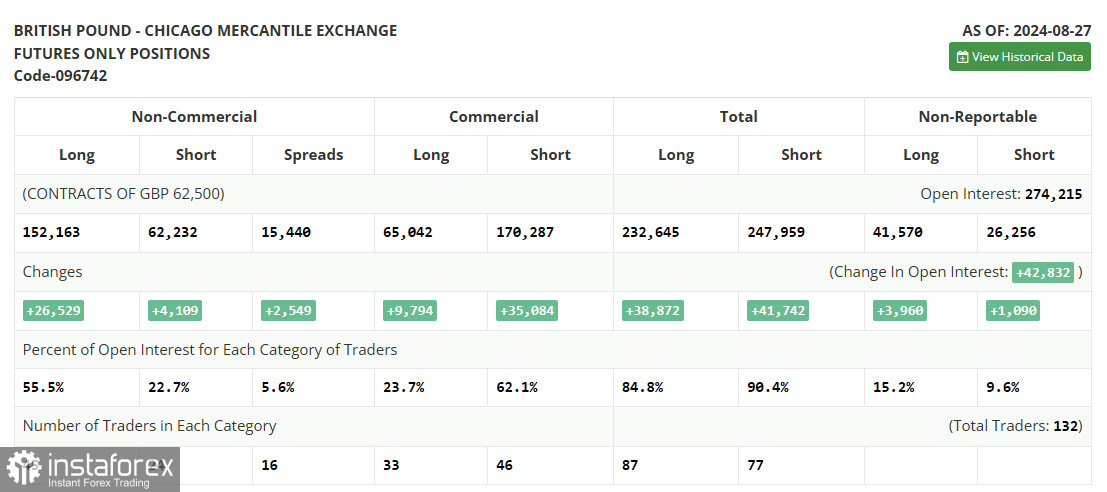
In the COT report (Commitment of Traders) for August 27, there was a sharp increase in long positions and a moderate increase in short positions. Traders believe that the reduction in U.S. interest rates is a much more significant event than similar actions by the Bank of England, leading to a continued shift towards buyers of the British pound, which has been increasing lately. This week features a lot of important U.S. statistics, which could further weaken the dollar's position, potentially returning the GBP/USD pair to a bullish trend. Reports related to the labor market will be particularly significant. The latest COT report indicates that long non-commercial positions increased by 26,529 to 152,163, while short non-commercial positions grew by 4,109 to 62,323. As a result, the gap between long and short positions increased by 2,549.
Indicator Signals:
Moving Averages
Trading is below the 30 and 50-day moving averages, indicating further decline in the pair.
Note: The periods and prices of moving averages are considered by the author on the hourly H1 chart and differ from the general definition of classic daily moving averages on the daily D1 chart.
Bollinger Bands
In the event of a decline, the lower boundary of the indicator around 1.3108 will serve as support.
Indicator Descriptions:
- Moving Average (MA): Determines the current trend by smoothing out volatility and noise. Period – 50. Marked in yellow on the chart.
- Moving Average (MA): Determines the current trend by smoothing out volatility and noise. Period – 30. Marked in green on the chart.
- MACD (Moving Average Convergence/Divergence): Fast EMA – period 12. Slow EMA – period 26. SMA – period 9.
- Bollinger Bands: Period – 20.
- Non-commercial Traders: Speculators such as individual traders, hedge funds, and large institutions using the futures market for speculative purposes and meeting certain requirements.
- Long Non-commercial Positions: The total long open position of non-commercial traders.
- Short Non-commercial Positions: The total short open position of non-commercial traders.
- Net Non-commercial Position: The difference between the short and long positions of non-commercial traders.
 English
 Русский
 Bahasa Indonesia
 Bahasa Malay
 ไทย
ไทย Español
 Deutsch
 Български
 Français
 Tiếng Việt
 中文
中文 বাংলা
বাংলা हिन्दी
 Čeština
 Українська
 Română

