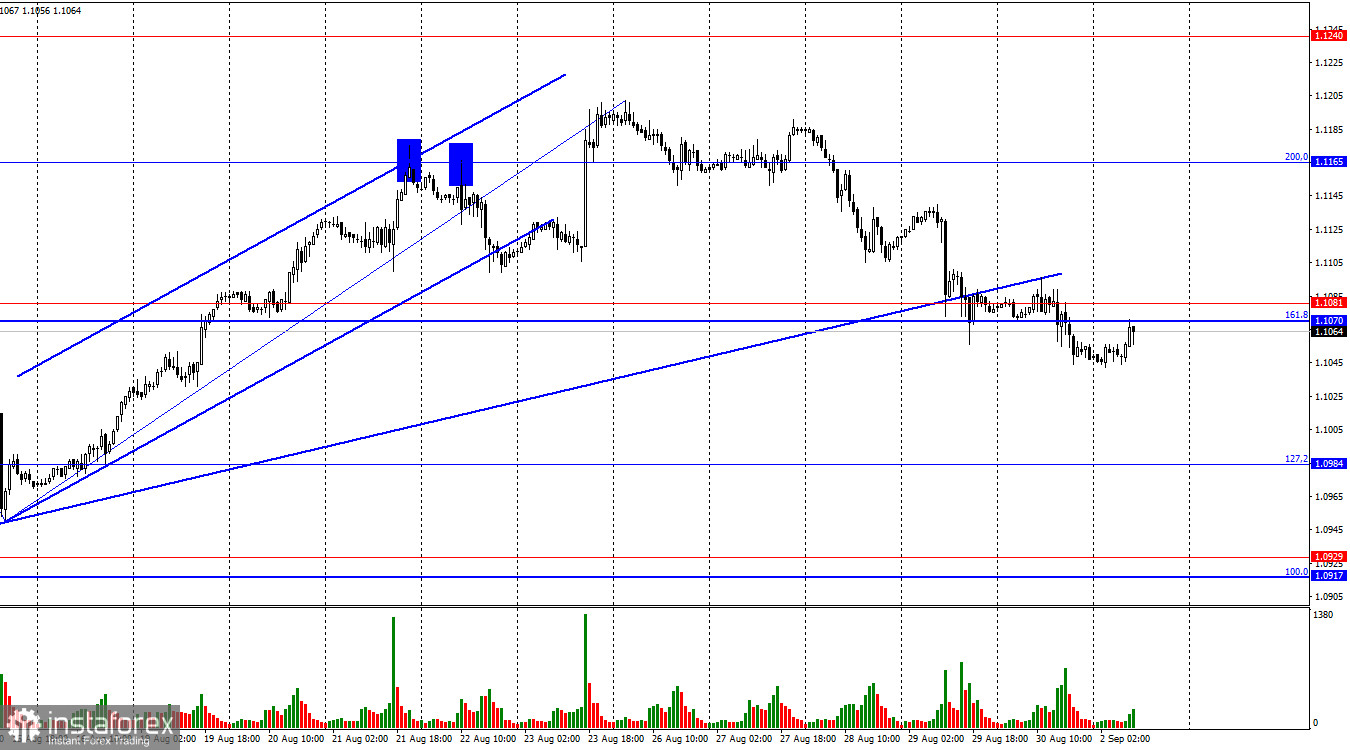
On Friday, the EUR/USD pair consolidated below the support zone of 1.1070–1.1081. Today, the price returned to this zone. A rebound from this zone would once again favor the U.S. dollar and resume the decline towards the 127.2% Fibonacci corrective level at 1.0984. Last week, the pair showed a decent decline, but this week's information backdrop will be crucial and potentially risky for the U.S. dollar. Therefore, bears are not rushing to open new sell positions. Consolidation above the 1.1070–1.1081 zone would benefit the euro and potentially resume growth towards the 200.0% Fibonacci level at 1.1165.

The wave situation has become slightly more complex, but there are no major issues overall. The last completed upward wave broke the peak of the previous wave, while the new downward wave has not come close to the last low from August 15. Thus, the "bullish" trend remains intact. To negate the "bullish" trend, bears would now need to break the low of the last downward wave, which is around 1.0950. To start, a close below the trendline is needed.
The information background on Friday was abundant but weak. Most reports matched traders' expectations. Specifically, Germany's unemployment rate was 6%, the inflation rate in the Eurozone was 2.2%, core inflation was 2.6%, the U.S. PCE index was 0.2%, and the consumer sentiment index was 67.9 points. All of these figures were in line with forecasts. Hence, there was a lot of news but nothing to act upon. Bears pushed the pair slightly lower, but this week, the "bearish" sentiment might diminish sharply, as important labor market and unemployment data will be released in the U.S. The market remembers how this data impacted the dollar in recent months; these reports led to the dollar's decline and prompted traders to anticipate more aggressive rate cuts from the Fed.

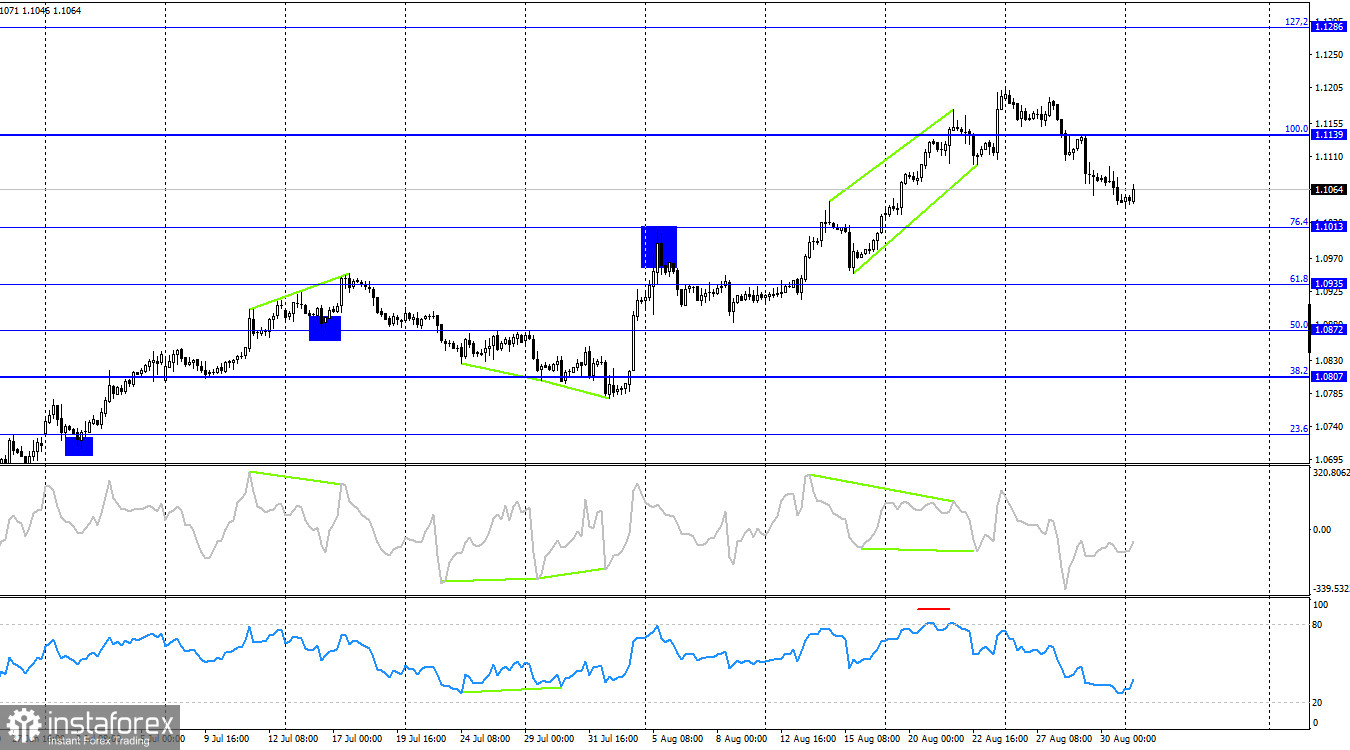
On the 4-hour chart, the pair consolidated below the 100.0% Fibonacci level at 1.1139, which suggests a potential decline of the euro towards the 76.4% corrective level at 1.1013. A rebound from the 1.1013 level could indicate a reversal in favor of the European currency and some growth towards 1.1139. No emerging divergences are observed with any indicator today.
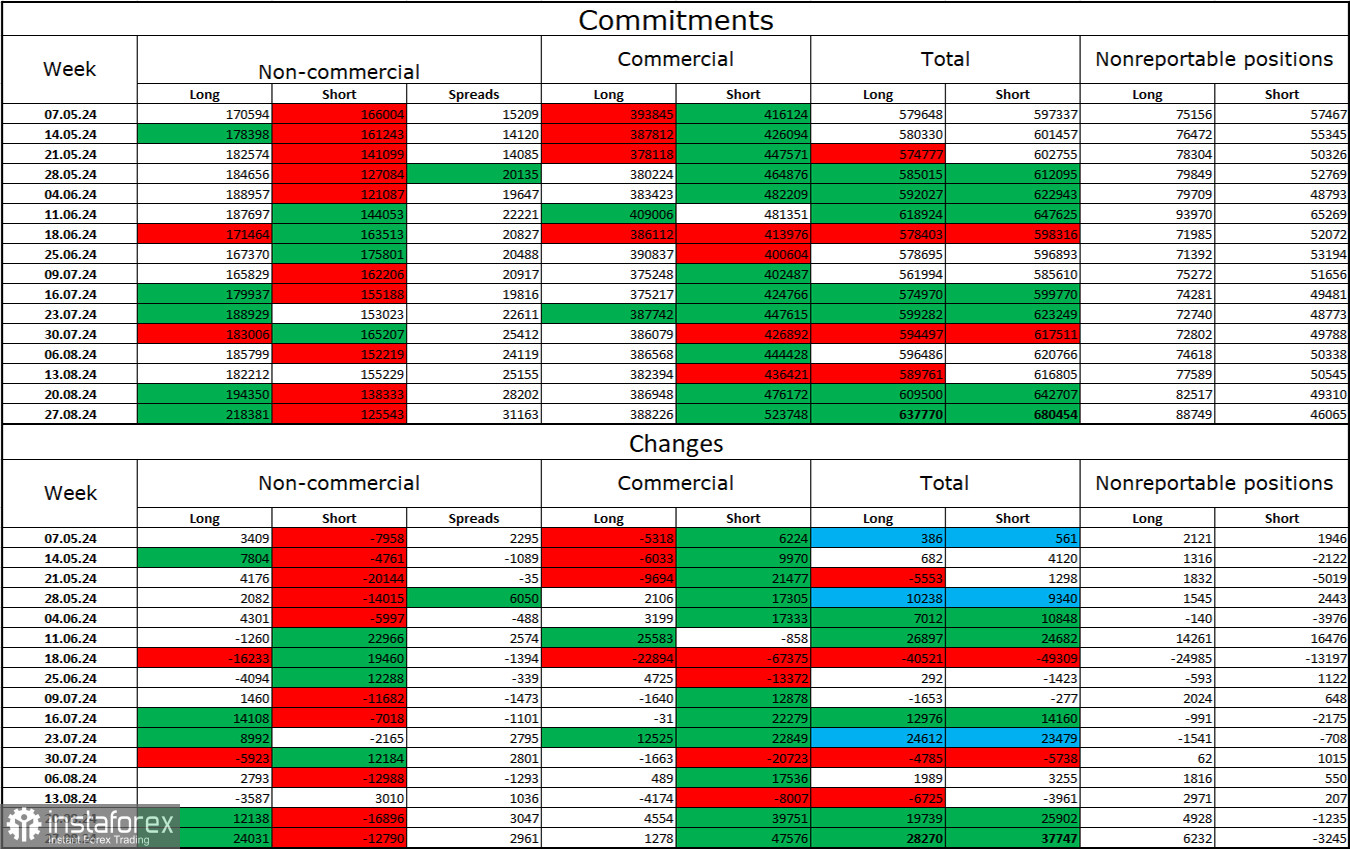
Commitments of Traders (COT) Report:

In the last reporting week, speculators opened 24,031 long positions and closed 12,790 short positions. The sentiment of the "Non-commercial" group shifted to "bearish" several months ago, but currently, bulls are actively dominating. The total number of long positions held by speculators is now 218,000, compared to 125,000 short positions.
I still believe the situation will continue to shift in favor of bears. I see no long-term reasons to buy the euro. It is also worth noting that a rate cut by the FOMC in September has already been priced in by the market with a 100% probability. The potential for a decline in the euro appears significant. However, the graphical analysis currently does not suggest a strong decline in the euro, and the information backdrop continues to present challenges for the dollar.
News Calendar for the U.S. and the Eurozone:
Eurozone – Germany Manufacturing PMI (07:55 UTC).
Eurozone – Manufacturing PMI (08:00 UTC).
On September 2, the economic events calendar includes only two entries, which are already known and had no impact. The influence of the information background on trader sentiment for the remainder of the day remains uncertain.
EUR/USD Forecast and Trading Tips:
Sales of the pair were possible with a close below the 1.1165 level on the hourly chart, targeting 1.1070–1.1081. This target has been reached. New sales are possible with a rebound from the 1.1070–1.1081 zone, targeting 1.0984. Purchases will be possible with a close above the 1.1070–1.1081 zone on the hourly chart, targeting 1.1165.
Fibonacci levels are set based on 1.0917–1.0668 on the hourly chart and 1.1139–1.0603 on the 4-hour chart.
 English
 Русский
 Bahasa Indonesia
 Bahasa Malay
 ไทย
ไทย Español
 Deutsch
 Български
 Français
 Tiếng Việt
 中文
中文 বাংলা
বাংলা हिन्दी
 Čeština
 Українська
 Română

