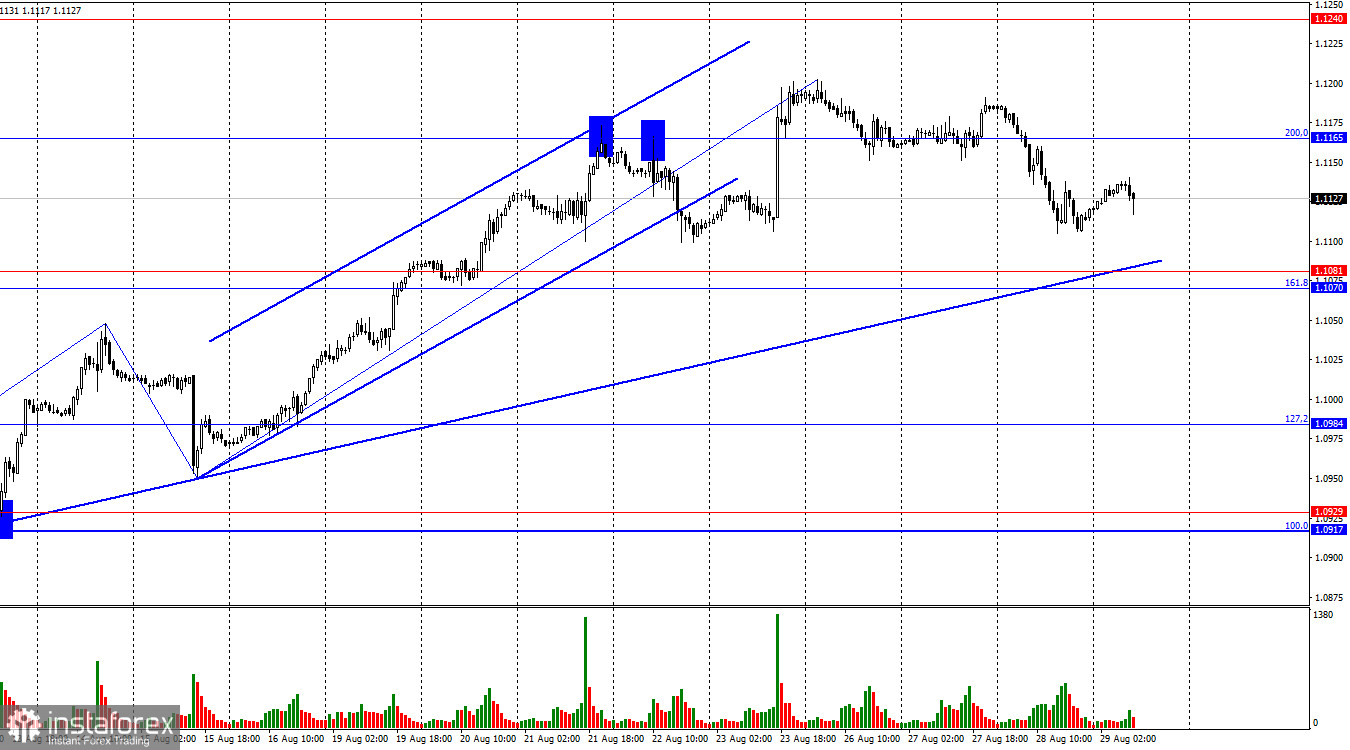
On Wednesday, the EUR/USD pair experienced a new reversal in favor of the U.S. dollar. It then consolidated below the 200.0% Fibonacci corrective level at 1.1165. Consequently, the decline may continue towards the support zone at 1.1070–1.1081, which coincides with an upward trendline. A rebound from these two support levels could lead to a reversal in favor of the euro and a resumption of the upward move towards the 1.1165 level.

The wave situation has become somewhat more complex, yet it remains generally clear. The last completed upward wave broke the peak of the previous wave, while the new downward wave has not yet approached the low from August 15. Thus, the "bullish" trend remains intact. To reverse the "bullish" trend, bears would need to break the low of the last downward wave, which is around 1.0950. Initially, a close below the trendline would be required.
The information provided on Wednesday was weak or non-existent. However, today, traders will get some data to consider. In a few hours, Germany will release its Consumer Price Index for August. Forecasts suggest a drop from 2.3% year-on-year to 2.1% year-on-year. If these forecasts are confirmed, and European inflation is also projected to decrease from 2.6%, the ECB may lower interest rates for the second time in September. I believe that in recent weeks, the market has been entirely focused on one event—the FOMC rate cut in September. The ECB was hardly considered, and if it was, it was not in the context of new monetary easing. However, traders' sentiment might start shifting to "bearish" as the bullish momentum wanes, and the focus will shift to the possibility of an ECB rate cut. This is certainly contingent on German and European inflation showing a slowdown rather than further acceleration.

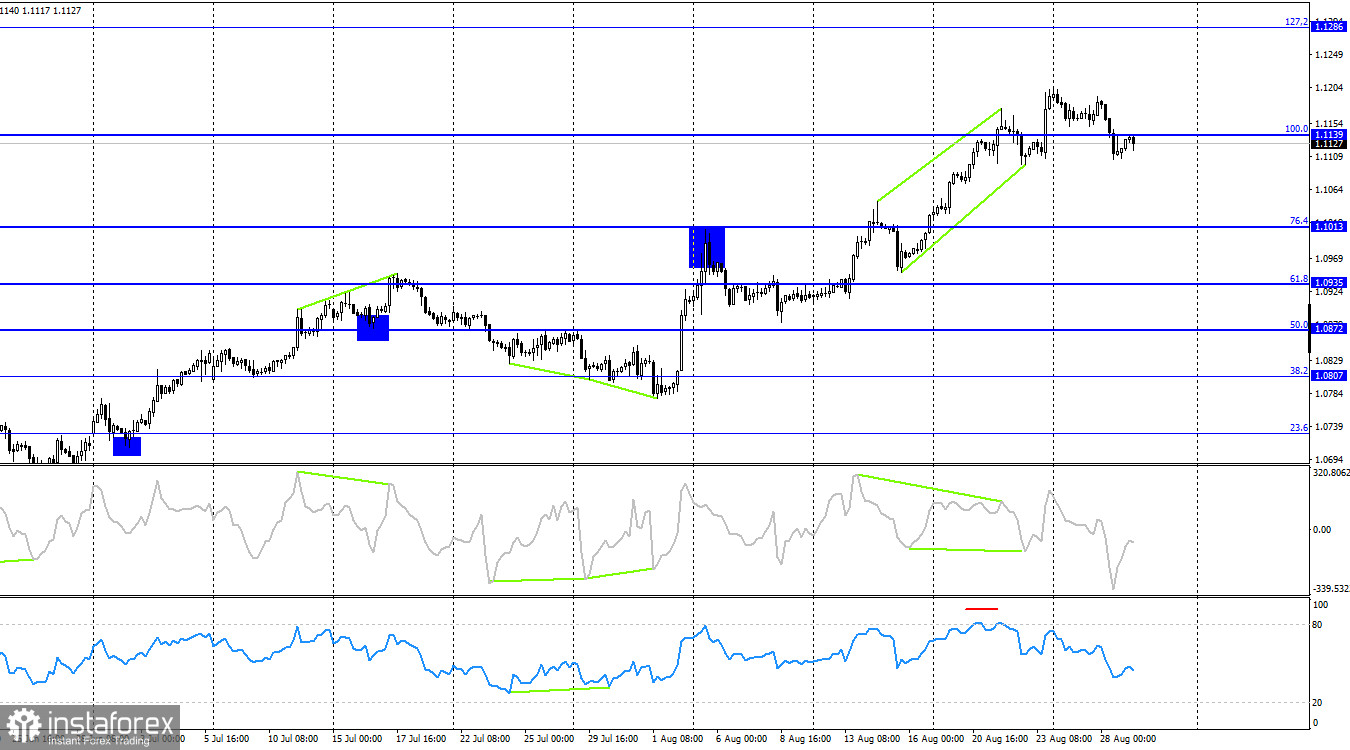
On the 4-hour chart, the pair has consolidated below the 100.0% Fibonacci level at 1.1139, indicating a potential for a further decline in the euro. The CCI indicator has formed a "bearish" divergence, and the RSI indicator has entered the overbought zone. Thus, there are sufficient factors for a potential decline in the pair in the near term. However, can the dollar expect significant growth soon? In my view, no. I recommend tracking changes on the hourly chart, as it is easier to do so.
Commitments of Traders (COT) Report:

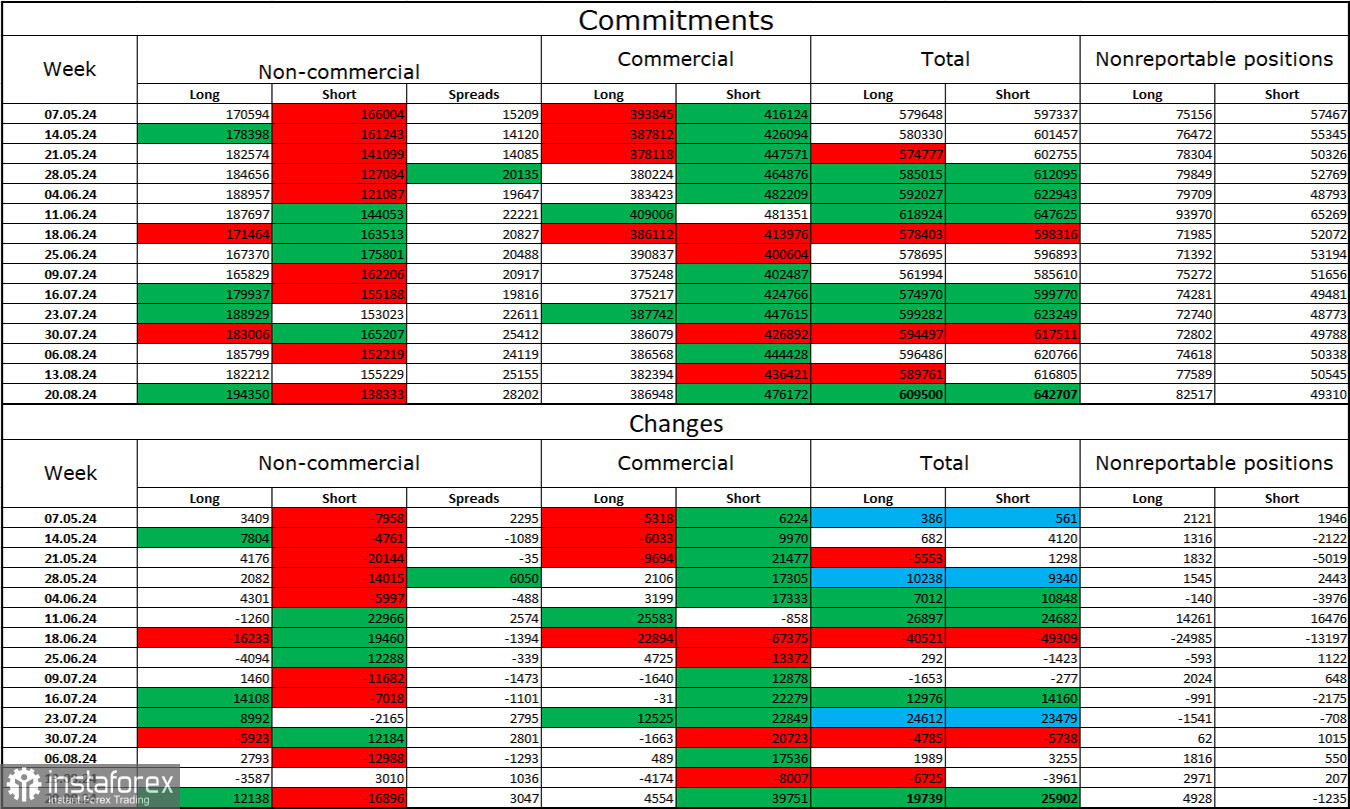
Over the last reporting week, speculators opened 12,138 long positions and closed 16,896 short positions. The sentiment among non-commercial traders shifted to "bearish" a few months ago, but currently, bulls are again dominant. The total number of long positions held by speculators is now 194,000, while short positions number 138,000.
I still believe that the situation will continue to shift in favor of the bears. I see no long-term reasons to buy euros as the ECB is beginning to ease its monetary policy. In America, rates will remain high at least until September 18. Additionally, the market has already priced in a rate cut in September with 100% probability. The potential for a decline in the European currency looks substantial. However, the graphical analysis currently does not support a strong decline in the euro, and the informational background regularly hinders the dollar.
Economic Calendar for the US and Eurozone:
- Eurozone – Consumer Price Index in Germany (12:00 UTC)
- US – GDP Change for Q2 (12:30 UTC)
- US – Changes in Initial Jobless Claims (12:30 UTC)
August 29 has three economic events scheduled. The impact of the information background on traders' sentiment for the remainder of the day will be moderate.
EUR/USD Forecast and Trading Advice:
Selling the pair may have been considered upon a close below the 1.1165 level on the hourly chart, targeting 1.1070–1.1081. These trades can currently be held open. Purchases could be considered if the pair rebounded from the 1.1070–1.1081 zone on the hourly chart, targeting 1.1165.
Fibonacci levels are drawn from 1.0917–1.0668 on the hourly chart and from 1.1139–1.0603 on the 4-hour chart.
 English
 Русский
 Bahasa Indonesia
 Bahasa Malay
 ไทย
ไทย Español
 Deutsch
 Български
 Français
 Tiếng Việt
 中文
中文 বাংলা
বাংলা हिन्दी
 Čeština
 Українська
 Română

