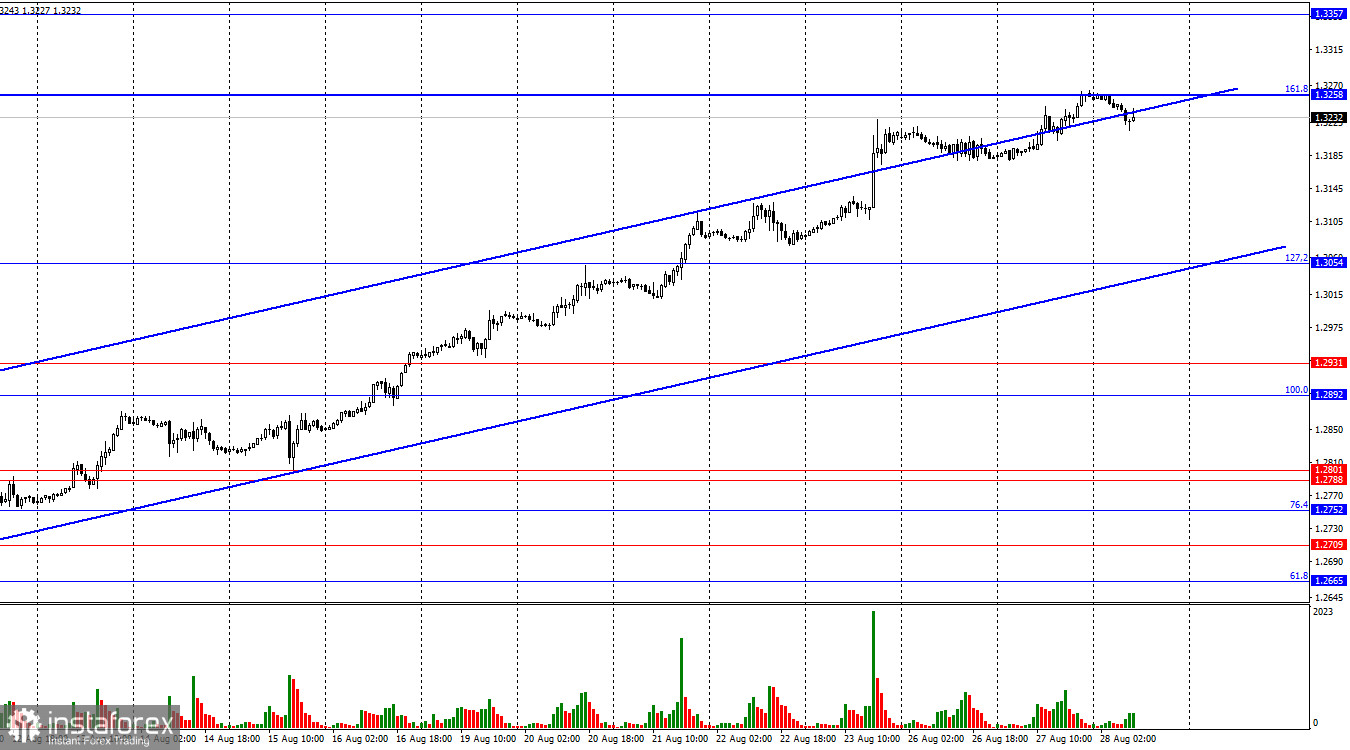
On the hourly chart, the GBP/USD pair resumed its upward movement on Tuesday and reached the 161.8% corrective level at 1.3258. A rebound from this level could lead to a reversal in favor of the US dollar and a decline towards the lower boundary of the upward trend channel, which continues to characterize traders' sentiment as "bullish." Consolidating the pair above the 1.3258 level will increase the likelihood of continued growth for the pound.

The wave structure is clear. The last completed downward wave failed to break the low of the previous wave, while the last upward wave managed to break the peak of the previous wave. Therefore, we are currently dealing with a clear "bullish" trend, but the waves are so large that any trend reversal will likely be identified with a significant delay. I simply do not see any internal waves to guide a trend reversal.
The information provided on Tuesday was quite weak. There were no significant news events in either the U.S. or the UK, but bulls continued to push the pound higher. At this time, I still expect the formation of a corrective wave, as some correction is needed before the upcoming Friday. Next week, important labor market and unemployment data will be released in the U.S., which will determine how much the FOMC will lower the interest rate on the 18th of September. These data could also significantly impact the pace of FOMC's monetary policy easing until the end of the current year. However, they will most influence traders' sentiment, which is now a key factor for the U.S. dollar. In recent weeks, the U.S. dollar has been in a persistent decline, not because of daily pessimistic news from the U.S., but because the market has been increasingly confident in a substantial Fed rate cut by the end of the year. The worse the upcoming labor market and unemployment reports are, the further the dollar may fall.

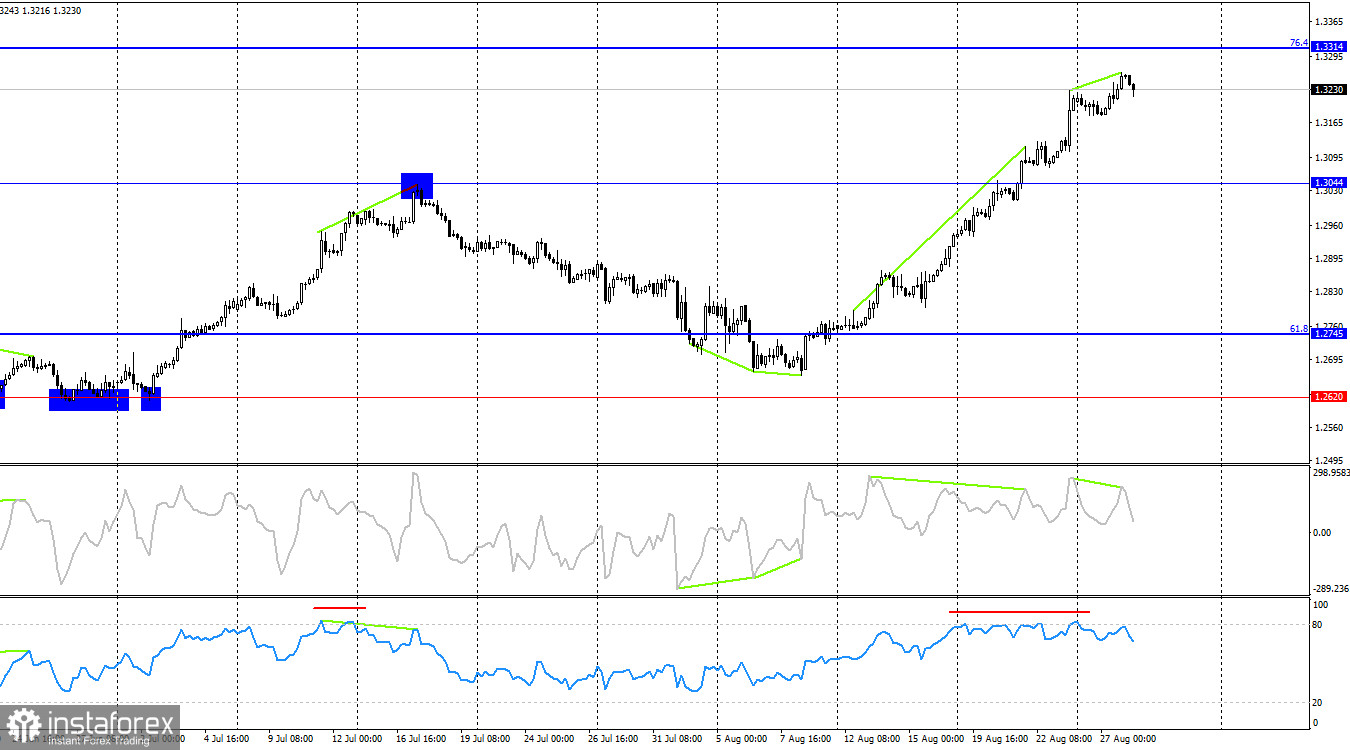
On the 4-hour chart, the pair has consolidated above the 1.3044 level. The CCI indicator has been warning of a "bearish" divergence for over a week, and the RSI indicator has been in overbought territory for a week, which rarely happens. Therefore, I would say that the likelihood of the pair falling in the coming days is high. However, the pair's consolidation above the 1.3044 level suggests that growth could continue towards the next Fibonacci level of 76.4% at 1.3314. The only signal for a decline in the pound is on the hourly chart.
Commitments of Traders (COT) Report:
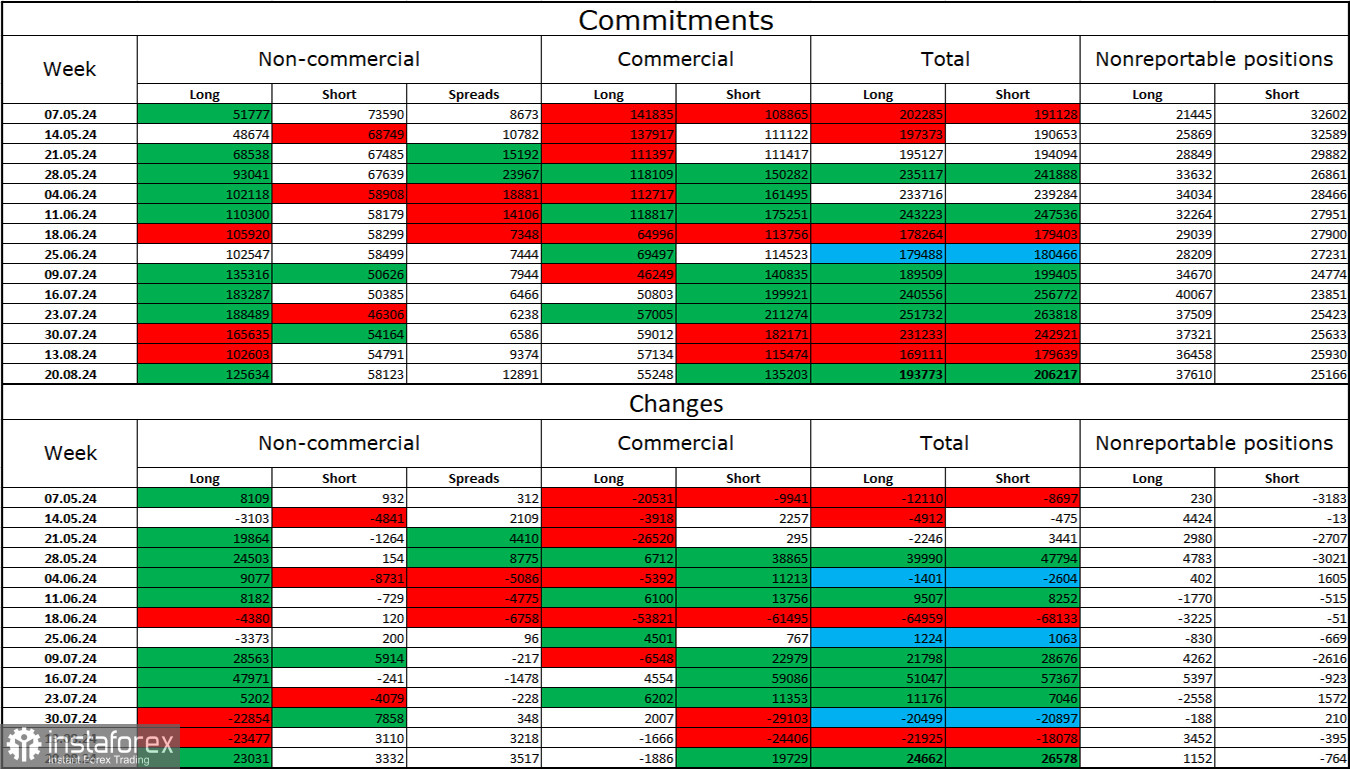
The sentiment among the "Non-commercial" category of traders became much more "bullish" during the last reporting week. The number of long positions held by speculators increased by 23,031, while the number of short positions increased by 3,332. Bulls still hold a solid advantage. The gap between long and short positions is nearly 67,000: 125,000 against 58,000.
In my view, the pound still faces prospects for a decline, but the COT reports currently suggest otherwise. Over the past three months, the number of long positions has increased from 51,000 to 125,000, while the number of short positions has decreased from 74,000 to 58,000. I believe that over time, professional players will again start reducing their long positions or increasing their short positions, as all possible factors for buying the British pound have already been priced in. However, it is important to remember that this is just a hypothesis. Technical analysis suggests a likely decline in the near future, but the current trend remains unequivocally "bullish."
Economic Calendar for the US and UK:
On Wednesday, the economic events calendar contains no entries. Therefore, the impact of the news flow on market sentiment will be absent today.
Forecast for GBP/USD and Trading Recommendations:
Selling the pair is possible today on a rebound from the 1.3258 level on the hourly chart, with a target of 1.3054. Purchases could have been opened upon closing above the 1.3054 level. The target was 1.3258, and this target has been achieved. I would not rush into new purchases, even if the pair closes above the 1.3258 level.
The Fibonacci grids are built on 1.2892–1.2298 on the hourly chart and 1.4248–1.0404 on the 4-hour chart.
 English
 Русский
 Bahasa Indonesia
 Bahasa Malay
 ไทย
ไทย Español
 Deutsch
 Български
 Français
 Tiếng Việt
 中文
中文 বাংলা
বাংলা हिन्दी
 Čeština
 Українська
 Română

