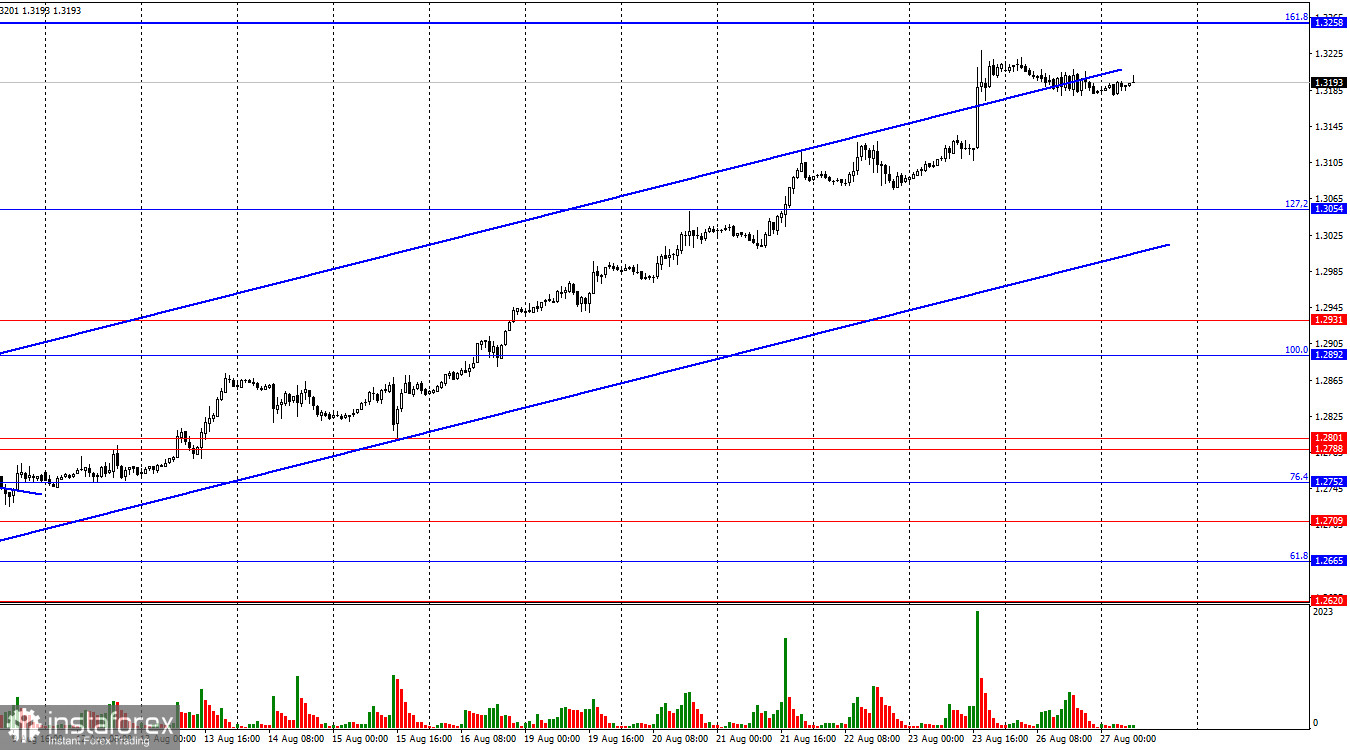
On the hourly chart, the GBP/USD pair traded horizontally on Monday. I cannot say there has been a reversal in favor of the U.S. dollar; the pair has simply stalled in its upward movement. Thus, from the current price level, the quotes may continue to rise towards the 161.8% retracement level at 1.3258, or they could start to decline towards the 127.2% level at 1.3054. However, the market sentiment will likely remain "bullish" as long as the price does not close below the upward trend channel.

The wave pattern presents no issues. The last downward wave did not break the previous wave's low, while the last upward wave managed to surpass the previous wave's peak. Thus, we are currently dealing with a "bullish" trend without any doubts, but all the waves are so large that identifying a trend change will be significantly delayed. I simply do not see any internal patterns that could indicate a trend reversal.
The news provided on Monday could have allowed the bears to launch at least a minor counterattack, but they judged it was not the right time, considering the U.S. durable goods orders report as a secondary one. I, of course, disagree with this view and continue to believe that the market is solely focused on the September FOMC meeting. As a result, the growth process may continue this week, driven by this single factor. Bulls might take a short pause, leading to a slight decline. Currently, the pair's price is at levels where there are no significant points for a potential reversal in favor of the dollar. The news provided today is weak, and on days when it's strong, it has not provided any support to the bears. For now, the dollar remains in a very unfavorable position, and it's difficult to say what might save it from further decline.

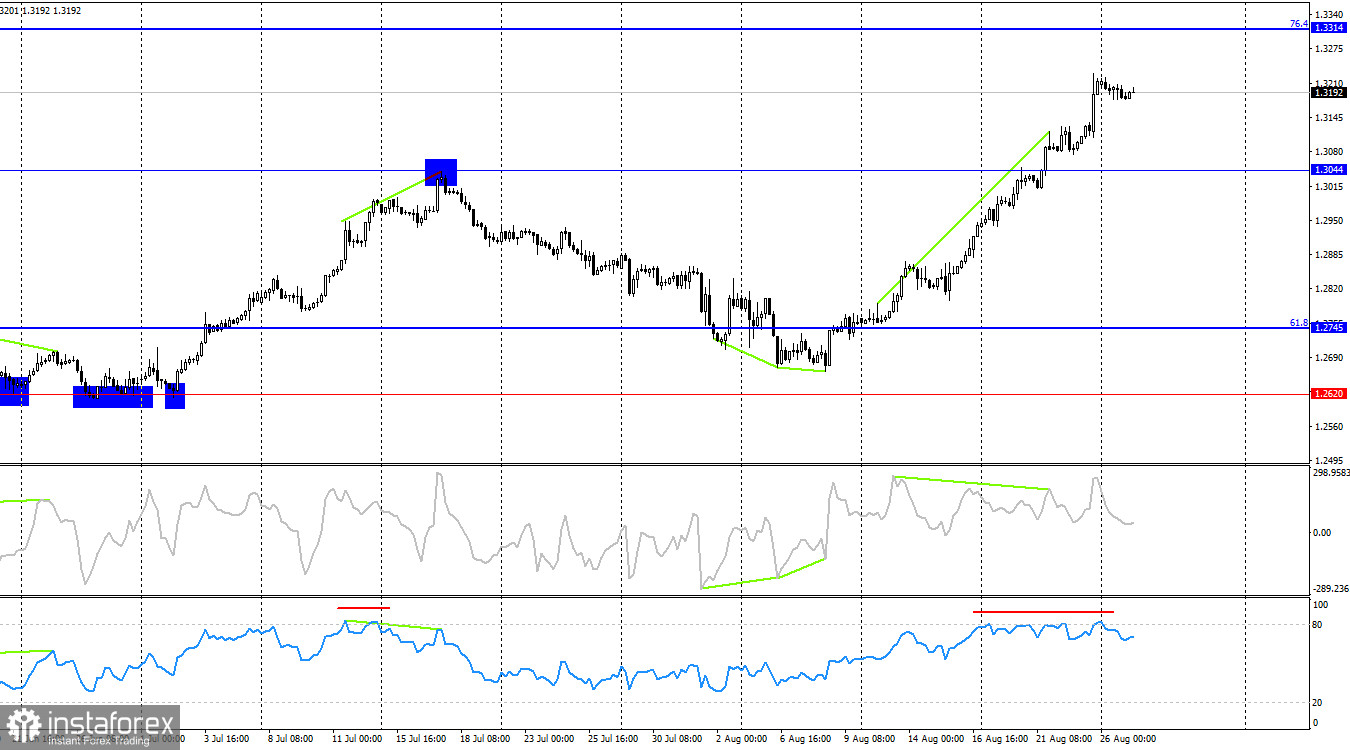
On the 4-hour chart, the pair has consolidated above the 1.3044 level. The CCI indicator has been warning of a "bearish" divergence for over a week, and the RSI has been in overbought territory for a week, which is a rare occurrence. Therefore, I would say that the likelihood of a decline in the pair over the coming days is high. However, at the moment, the consolidation above the 1.3044 level suggests a continuation of the upward movement towards the next Fibonacci level of 76.4% at 1.3314. There are currently no signals of a trend reversal.
Commitments of Traders (COT) Report:

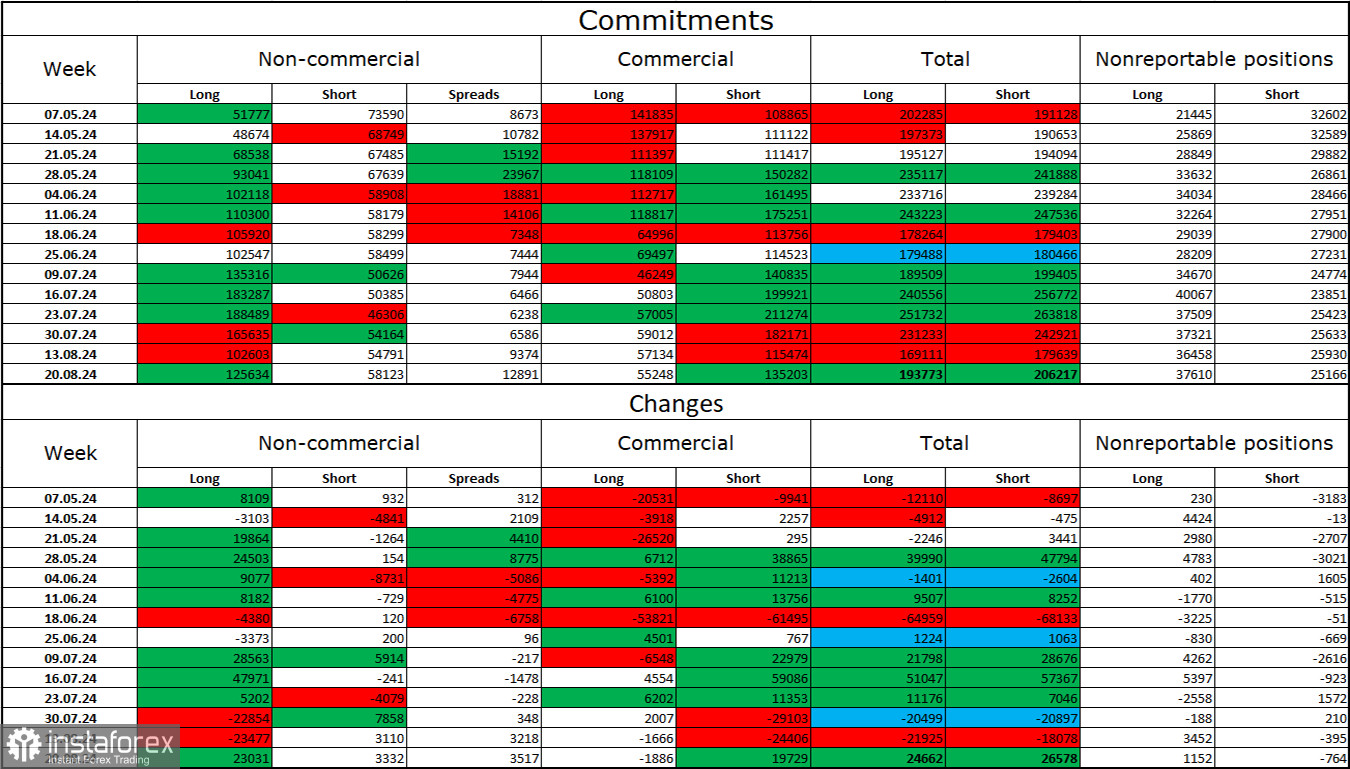
The sentiment of the "Non-commercial" trader category became much more "bullish" in the last reporting week. The number of long positions held by speculators increased by 23,031, while the number of short positions increased by 3,332. Bulls still hold a solid advantage. The gap between the number of long and short positions is nearly 67,000—125,000 versus 58,000.
In my opinion, the pound still has prospects for a decline, but the COT reports currently suggest otherwise. Over the past three months, the number of long positions has grown from 51,000 to 125,000, while the number of short positions has decreased from 74,000 to 58,000. I believe that over time, professional players will start to reduce their long positions or increase their short positions again, as all possible factors for buying the British pound have already been priced in. However, it's important to remember that this is just speculation. Technical analysis suggests a possible decline in the near future, though the overall trend remains clearly "bullish" for now.
News Calendar for the U.S. and the UK:
On Tuesday, the economic calendar contains no significant entries. The influence of the news background on market sentiment will be absent today.
Forecast for GBP/USD and Trading Tips:
Selling the pair is possible after a rebound from the 1.3258 level on the hourly chart, targeting 1.3054. Purchases could have been made upon closing above the 1.3054 level with a target of 1.3258. However, at this point, I would consider closing these positions.
Fibonacci levels are drawn from 1.2892 to 1.2298 on the hourly chart and from 1.4248 to 1.0404 on the 4-hour chart.
 English
 Русский
 Bahasa Indonesia
 Bahasa Malay
 ไทย
ไทย Español
 Deutsch
 Български
 Français
 Tiếng Việt
 中文
中文 বাংলা
বাংলা हिन्दी
 Čeština
 Українська
 Română

