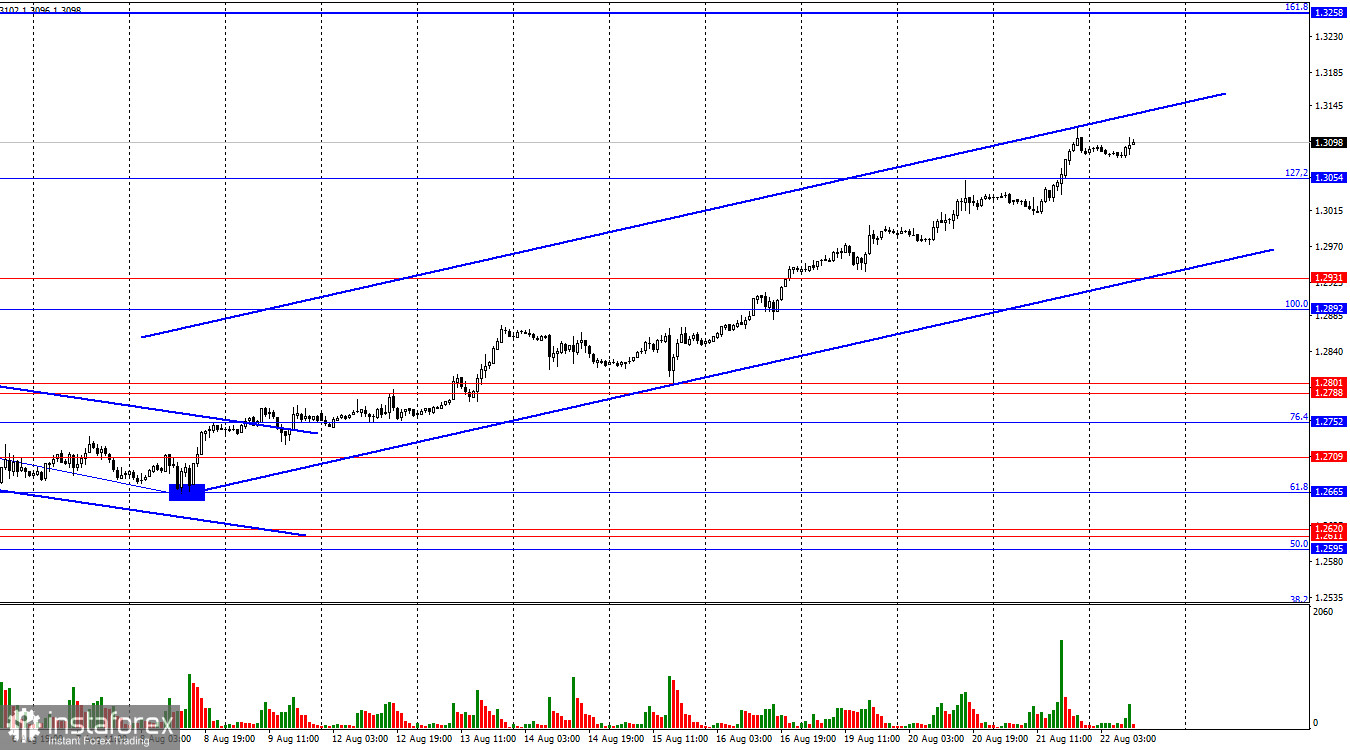
On the hourly chart, the GBP/USD pair continued its upward movement on Wednesday and consolidated above the 127.2% corrective level at 1.3054. This consolidation suggests that the pair may now continue to rise toward the next Fibonacci level of 161.8%, which is at 1.3258. A close below the 1.3054 level would indicate a potential decline toward the lower boundary of the upward trend channel, which still reflects a "bullish" sentiment among traders.

The wave pattern presents no major concerns. The last downward wave failed to break the previous low, while the subsequent upward wave only slightly surpassed the previous peak by a few points. Thus, we are currently dealing with a "bullish" trend, but the waves are so large that identifying a trend reversal would be significantly delayed. I simply don't see any internal waves that could serve as a reference for a trend break.
Wednesday's news coverage was quite extensive, yet it once again favored the bulls. The annual Nonfarm Payrolls report predictably came in worse than expected, and the FOMC minutes from the July 30-31 meeting confirmed that many committee members are seriously considering the need to start easing monetary policy. However, the minutes did not provide precise information. For example, they did not specify that a rate cut must happen in September, nor did they clarify how many FOMC members support or oppose a rate cut—information that is crucial for understanding what to expect from the U.S. regulator at the next meeting. Nevertheless, the market received two more signals indicating that the U.S. labor market is struggling and that the Fed is ready to start easing monetary policy. This contributed to a drop in the U.S. dollar.

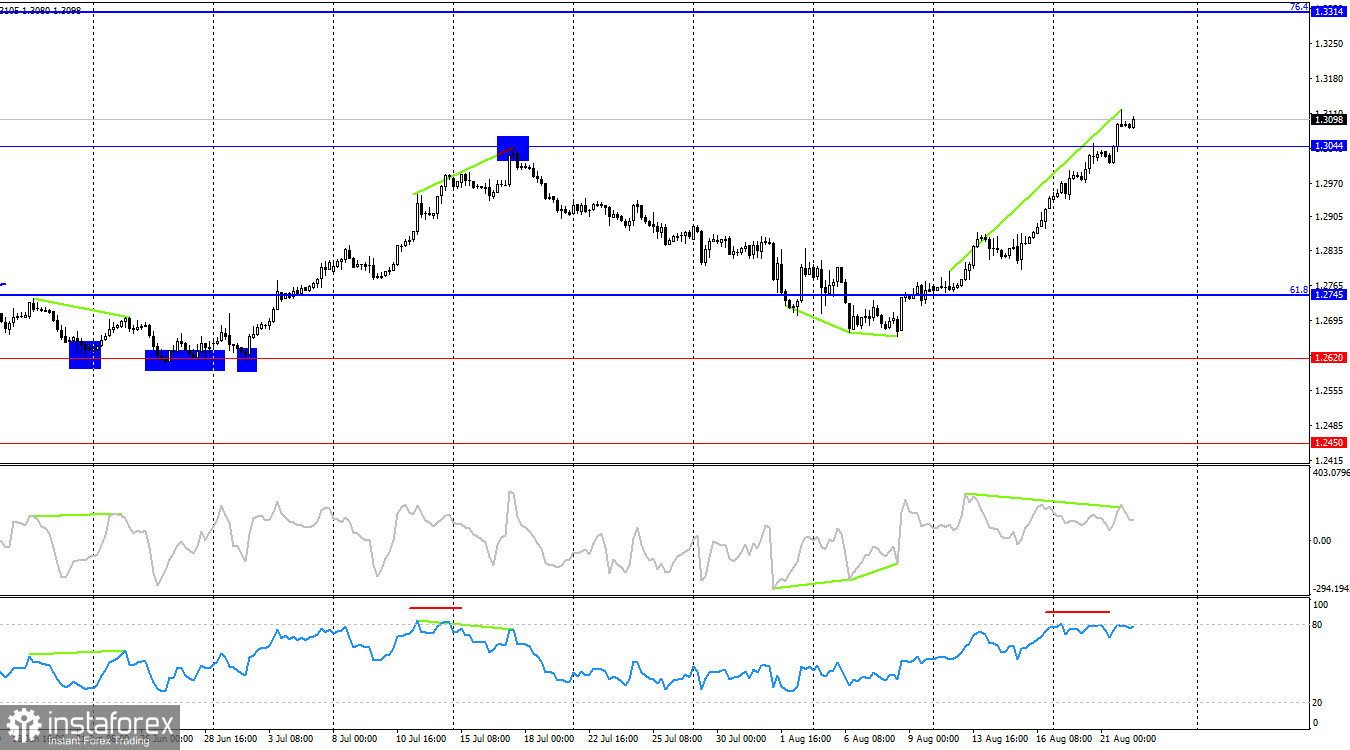
On the 4-hour chart, the pair consolidated above the 1.3044 level. The CCI indicator has been warning of a "bearish" divergence for a week now, and the RSI is in overbought territory, which is uncommon. Thus, I would say that the probability of the pair declining in the coming days is high. However, currently, the consolidation above the 1.3044 level suggests that the upward movement could continue toward the next Fibonacci level at 76.4%, which is at 1.3314.
Commitments of Traders (COT) Report:
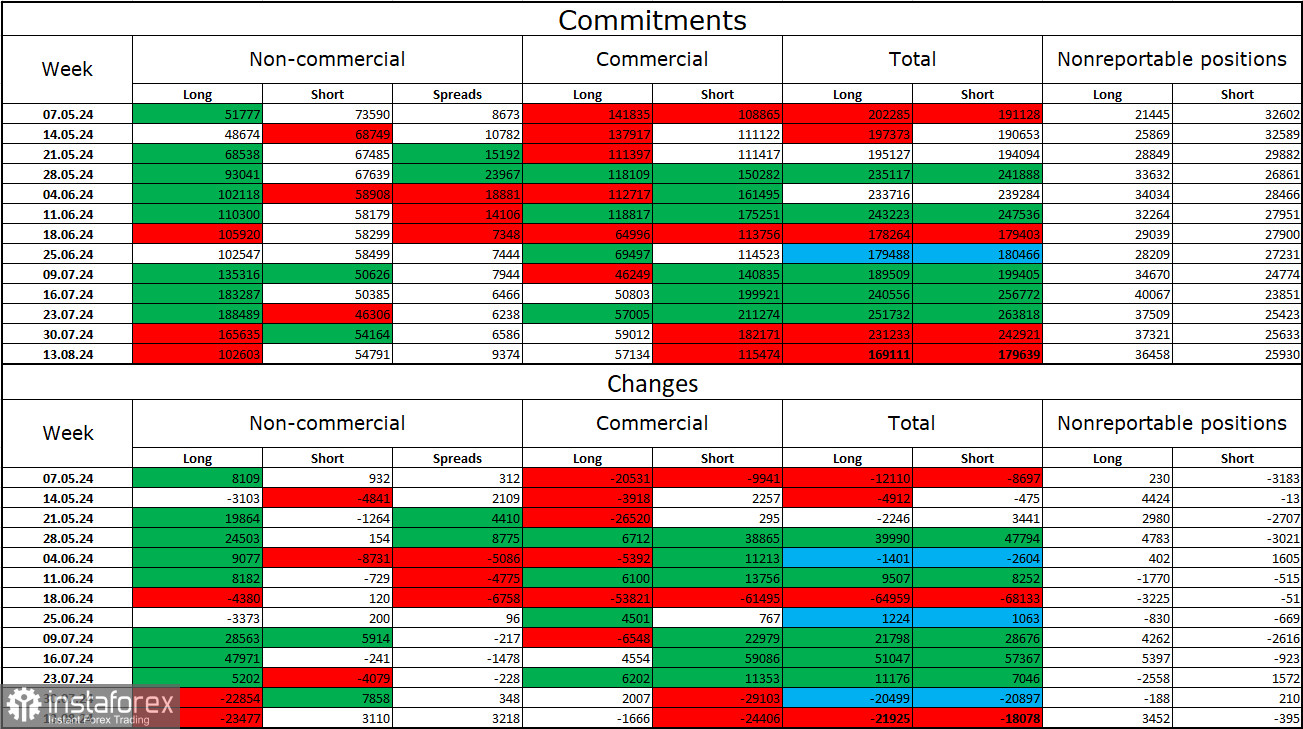
The sentiment among "Non-commercial" traders became significantly less "bullish" in the last reporting week. The number of long positions held by speculators decreased by 23,477, while the number of short positions increased by 3,110. Bulls still maintain a solid lead, with a difference of nearly 50,000 positions: 102,000 long versus 55,000 short.
In my opinion, there is still potential for the pound to decline, but the COT reports currently suggest otherwise. Over the past three months, the number of long positions has increased from 51,000 to 102,000, while the number of short positions has decreased from 74,000 to 55,000. I believe that, over time, professional players will start to reduce their long positions or increase their short positions, as all possible factors for buying the British pound have already been priced in. However, it's crucial to note that this is a speculative assumption. Technical analysis suggests a likely decline in the near future, but this doesn't necessarily mean that the decline will last several months or half a year.
News Calendar for the U.S. and the UK:
- UK – Manufacturing PMI (08:30 UTC)
- UK – Services PMI (08:30 UTC)
- U.S. – Initial Jobless Claims (12:30 UTC)
- U.S. – Manufacturing PMI (13:45 UTC)
- U.S. – Services PMI (13:45 UTC)
The economic calendar on Thursday includes five key events, two of which have already supported the bulls. The impact of these events on market sentiment is expected to be moderate.
Forecast for GBP/USD and Trading Tips:
Selling the pair is possible today if it closes below 1.3054 on the hourly chart, targeting 1.2931. New buying opportunities were available yesterday when the pair closed above 1.3044, with a target of 1.3258.
Fibonacci grids are built from 1.2892 to 1.2298 on the hourly chart and from 1.4248 to 1.0404 on the 4-hour chart.
 English
 Русский
 Bahasa Indonesia
 Bahasa Malay
 ไทย
ไทย Español
 Deutsch
 Български
 Français
 Tiếng Việt
 中文
中文 বাংলা
বাংলা हिन्दी
 Čeština
 Українська
 Română

