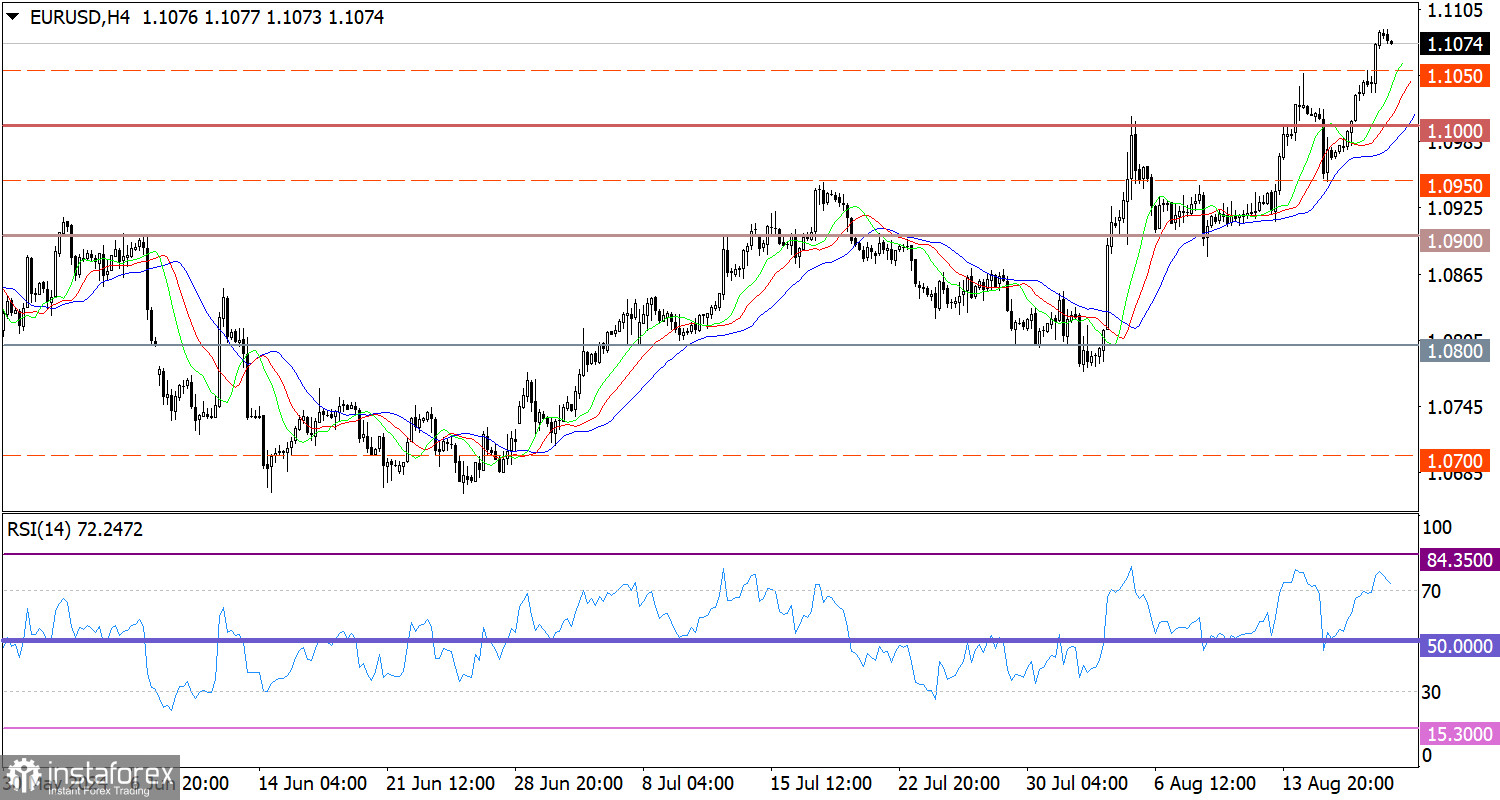
During its momentum-driven rise, the EUR/USD pair has surpassed the 1.1050 level. This indicates that the psychological level of 1.1000 has lost its strength against buyers.
In the 4-hour chart, the RSI technical indicator is in the overbought zone, suggesting an excessive number of long positions.
Regarding the Alligator indicator in the same time frame, the moving average lines are aligned with the direction of the trend.
Expectations and Prospects
From a technical perspective, stabilizing the price above the 1.1050 level on the daily time frame indicates a prevailing bullish sentiment among buyers. In the long term, this movement could lead to a test of the high set in July 2023. However, signs of local overbought conditions should not be overlooked, as this could theoretically lead to a temporary pullback, which would signal a positive realignment of trading forces.
The complex indicator analysis suggests an upward cycle in the short-term and intraday periods.
 English
 Русский
 Bahasa Indonesia
 Bahasa Malay
 ไทย
ไทย Español
 Deutsch
 Български
 Français
 Tiếng Việt
 中文
中文 বাংলা
বাংলা हिन्दी
 Čeština
 Українська
 Română

