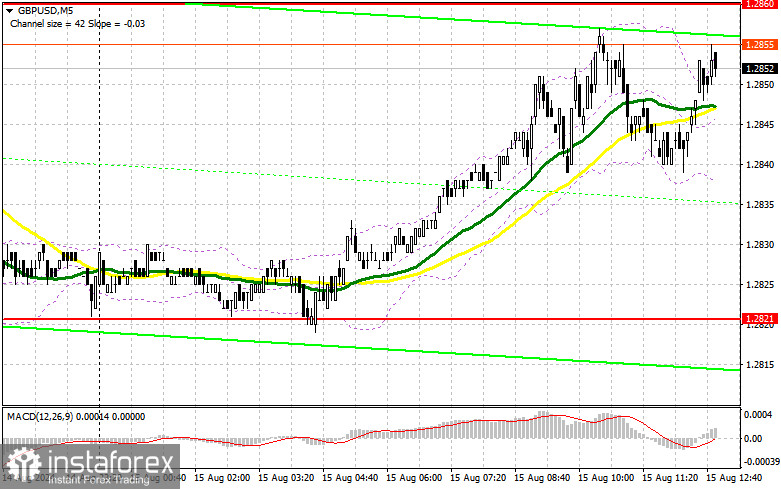
In my morning forecast, I focused on the 1.2821 level and planned to make market entry decisions based on it. Let's look at the 5-minute chart and see what happened. The decline occurred, but there was no formation of a false breakout at 1.2821. As a result, I was left without entry points into the market. The technical outlook has not changed for the second half of the day.

For Opening Long Positions on GBP/USD:
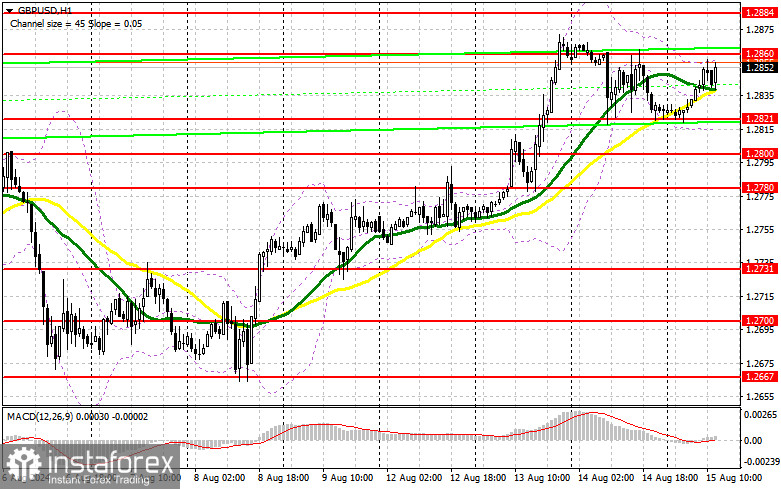
The UK's GDP report was decent, but it wasn't enough to spur buyers into more active action. Now we await the U.S. retail sales data for July. I hope the market will react more significantly to these numbers, and we'll see the levels I mentioned get tested. Additionally, we expect figures on initial jobless claims, industrial production changes, and a speech by FOMC member Patrick T. Harker. Strong data could weaken the pound and lead to a drop in the pair, which I plan to take advantage of. A false breakout around 1.2821 would be a suitable scenario for opening long positions, targeting a rise toward the 1.2860 resistance formed by yesterday's results. A breakout and retest of this range from top to bottom on news of declining U.S. retail sales would increase the chances of pound growth, providing an entry point for long positions with potential exits at 1.2884 and 1.2910. The ultimate target would be the 1.2939 level, where I plan to take profit. If GBP/USD declines and there is no bullish activity around 1.2821, especially near the moving averages, the pound could face a more significant drop. This could result in a decline and retest of the next support at 1.2800, raising the chances of a more substantial fall in the pair. Therefore, only a false breakout formation would be a suitable condition for opening long positions. I plan to buy GBP/USD immediately if the price rebounds from the 1.2780 minimum, targeting a 30-35 point correction within the day.
For Opening Short Positions on GBP/USD:
Sellers have shown they are still in control, and the next moves will depend on the incoming data. If the pair rises on US statistics, a false breakout at 1.2860 would confirm the presence of major players betting on a pound decline, providing an opportunity to open new short positions aiming for a retest of the 1.2821 support. A breakout and retest of this range from bottom to top, combined with a hawkish stance from FOMC members, would significantly pressure buyers, triggering stop-loss orders and opening the way to 1.2800. The ultimate target would be the 1.2780 level, where I plan to take profit. Testing this level could seriously challenge the bullish outlook for the pound. If GBP/USD rises and there is no activity at 1.2860 in the second half of the day (bearing in mind that the trend is upward), buyers will have a good chance of pushing the pair higher. In that case, I would postpone sales until a false breakout at 1.2884 and 1.2910. If there is no downward movement, I will sell GBP/USD immediately on a rebound from 1.2939, targeting a 30-35 point correction within the day.

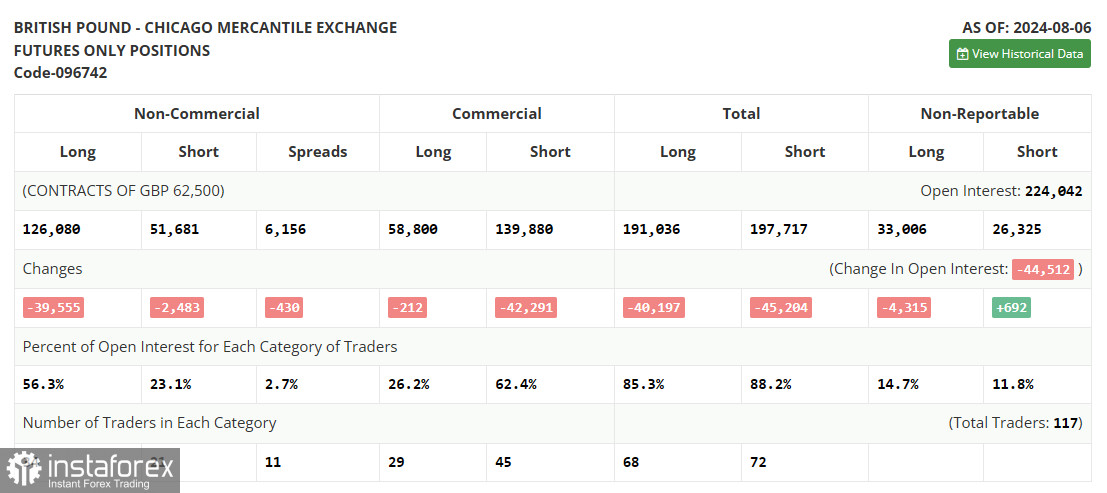
In the COT report (Commitment of Traders) for August 6, there was a significant reduction in long positions and a slight decrease in short positions. This change in the balance of power is not surprising, as the Bank of England made it clear after its meeting that it intends to lower interest rates, as the economy now needs special support more than ever after inflation has been brought under control. Much will depend on new inflation and labor market statistics, but it seems that the British regulator will definitely go for one rate cut this fall, which limits the pound's current upward potential in the medium term. The latest COT report shows that long non-commercial positions fell by 39,555 to 126,087, while short non-commercial positions decreased by 2,483 to 54,681. As a result, the spread between long and short positions narrowed by 430.
Indicator Signals:
Moving Averages
Trading is above the 30 and 50-day moving averages, indicating further growth for the pound.
Note: The period and prices of moving averages are considered by the author on the H1 hourly chart and differ from the general definition of classic daily moving averages on the D1 daily chart.
Bollinger Bands
In the event of a decline, the lower boundary of the indicator around 1.2821 will serve as support.
Indicator Descriptions:
- Moving average: A moving average that determines the current trend by smoothing volatility and noise. Period 50. Marked in yellow on the chart.
- Moving average: A moving average that determines the current trend by smoothing volatility and noise. Period 30. Marked in green on the chart.
- MACD Indicator: Moving Average Convergence/Divergence—the convergence/divergence of moving averages. Fast EMA period 12. Slow EMA period 26. SMA period 9.
- Bollinger Bands: Bollinger Bands. Period 20.
- Non-commercial traders: Speculators, such as individual traders, hedge funds, and large institutions, that use the futures market for speculative purposes and meet certain requirements.
- Long non-commercial positions: The total long open position of non-commercial traders.
- Short non-commercial positions: The total short open position of non-commercial traders.
- Total non-commercial net position: The difference between short and long positions of non-commercial traders.
 English
 Русский
 Bahasa Indonesia
 Bahasa Malay
 ไทย
ไทย Español
 Deutsch
 Български
 Français
 Tiếng Việt
 中文
中文 বাংলা
বাংলা हिन्दी
 Čeština
 Українська
 Română

