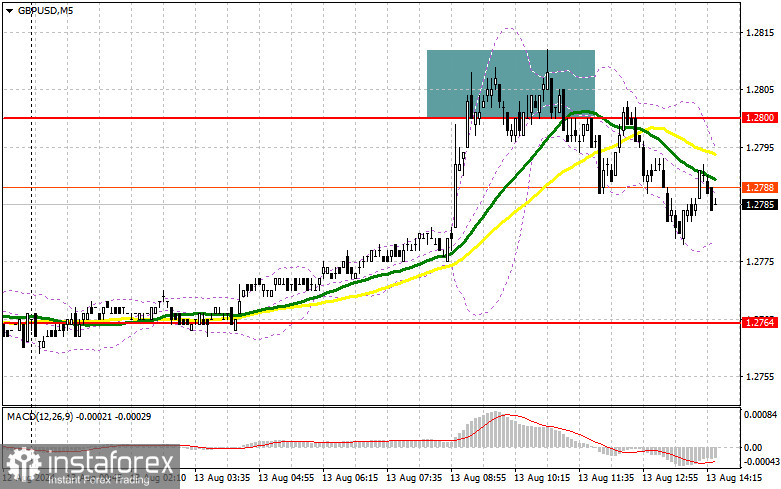
In my morning forecast, I highlighted the 1.2800 level and planned to base my trading decisions on it. Let's review the 5-minute chart to see what happened. The rise and the formation of a false breakout at 1.2800 led to a selling point for the pound, resulting in a 30-point drop in the pair. The technical picture was partially reassessed for the second half of the day.

For Opening Long Positions on GBP/USD:
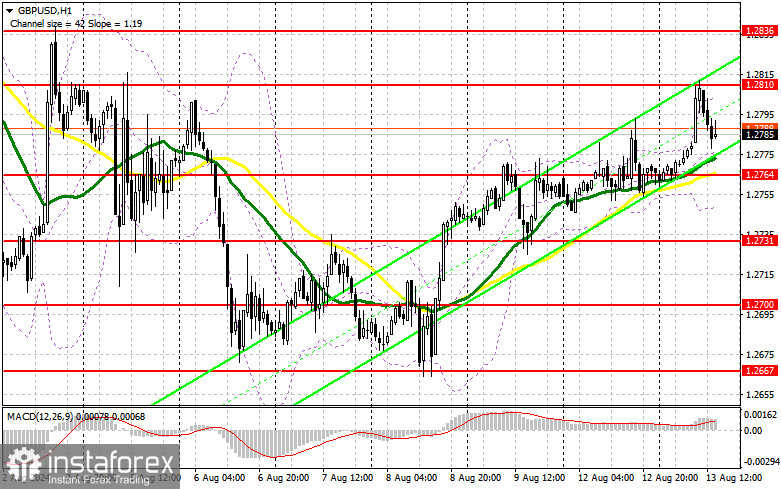
As you can see, pound buyers didn't last long after the labor market statistics were released, which created a challenging environment for buying the pound. As a result, the buyers' initiative quickly faded without support from large players, and the rise only influenced the pair's technical picture. In the second half of the day, we expect a similarly interesting report on the U.S. Producer Price Index, as well as data from the NFIB Small Business Optimism Index. The speech by FOMC member Raphael Bostic will also attract attention. His dovish comments could weaken the dollar, providing pound buyers with an opportunity for renewed growth. If the pair declines, I prefer to focus on the nearest support at 1.2764, which was established today and is aligned with the moving averages. Only a false breakout would be a suitable scenario for opening long positions, targeting growth towards the resistance at 1.2810, which has already been tested once today. A breakout followed by a top-down retest of this range would increase the chances of a rise in the pound, leading to a long position entry with a potential exit at 1.2836. The ultimate target would be the 1.2860 level, where I plan to take profits. If GBP/USD declines and buyer interest is absent around 1.2764 in the second half of the day, which I personally doubt, the pound could experience a more significant drop. This would lead to a decline and an update of the next support at 1.2731, increasing the chances of a larger drop in the pair. Therefore, only a false breakout would be a suitable condition for opening long positions. I plan to buy GBP/USD immediately on a rebound from the 1.2700 minimum, targeting a 30-35 point correction within the day.
For Opening Short Positions on GBP/USD:
Sellers have demonstrated that they remain active in the market. If the pair rises, another false breakout at 1.2810, similar to what I discussed earlier, would confirm the presence of large players betting on further declines in the pound. This would provide an opportunity to open new short positions with the target of testing the support at 1.2764, which will be difficult to break. A breakout and a bottom-up retest of this range would deal a blow to the buyers' positions, triggering stop-loss orders and opening the way to 1.2731. The ultimate target would be the 1.2700 level, where I plan to take profits. Testing this level could potentially restore the bearish trend. In the event of a rise in GBP/USD and no seller activity at 1.2810 in the second half of the day, buyers will have a good chance to further recover the pair. In that case, I will postpone sales until a false breakout at 1.2836. If there is no downward movement, I will sell GBP/USD immediately on a rebound from 1.2860, but only targeting a 30-35 point downward correction within the day.
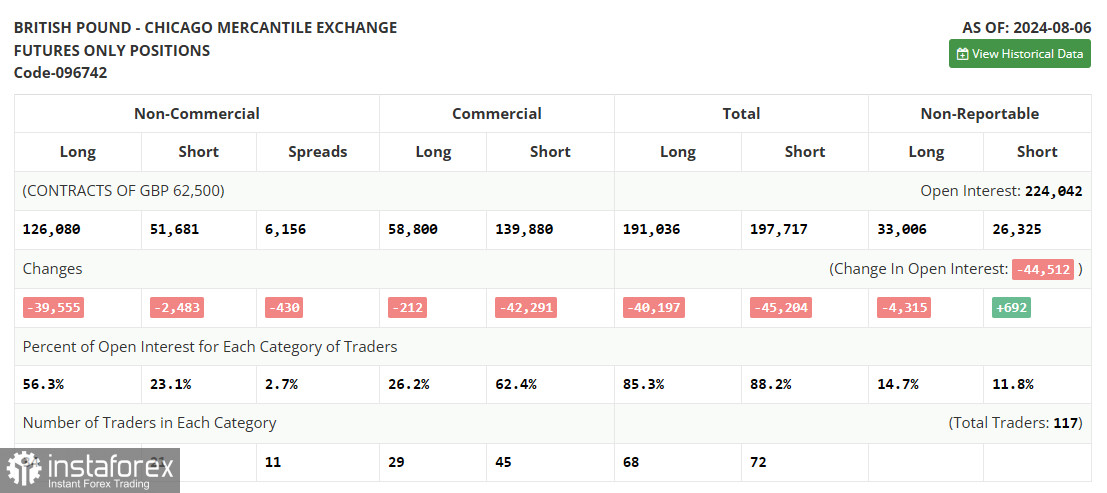
In the COT report for August 6, there was a sharp reduction in long positions and a slight decrease in short positions. Such a shift in the balance of power is not surprising, as the Bank of England made it clear after its meeting that it plans to cut interest rates. Now more than ever, after controlling inflation, the economy requires special support. A lot will depend on new inflation and labor market data, but it seems that the British regulator is likely to make at least one rate cut this fall, which limits the pound's current upward potential in the medium term. The latest COT report shows that long non-commercial positions decreased by 39,555 to a total of 126,087, while short non-commercial positions decreased by 2,483 to 54,681. As a result, the gap between long and short positions fell by 430.
Indicator Signals:
Moving Averages:Trading is conducted above the 30 and 50-day moving averages, indicating further growth for the pound.
Note: The period and prices of the moving averages considered by the author are on the H1 hourly chart and differ from the general definition of classic daily moving averages on the D1 daily chart.
Bollinger Bands:In case of a decline, the lower boundary of the indicator around 1.2755 will serve as support.
Indicator Descriptions:
- Moving Average (MA): Determines the current trend by smoothing volatility and noise. Period 50 is marked in yellow on the chart.
- Moving Average (MA): Determines the current trend by smoothing volatility and noise. Period 30 is marked in green on the chart.
- MACD (Moving Average Convergence/Divergence): Fast EMA period 12, Slow EMA period 26, SMA period 9.
- Bollinger Bands: Period 20.
- Non-commercial traders: Speculators such as individual traders, hedge funds, and large institutions using the futures market for speculative purposes and meeting certain criteria.
- Long non-commercial positions: Represent the total long open position of non-commercial traders.
- Short non-commercial positions: Represent the total short open position of non-commercial traders.
- Net non-commercial position: The difference between short and long positions of non-commercial traders.
 English
 Русский
 Bahasa Indonesia
 Bahasa Malay
 ไทย
ไทย Español
 Deutsch
 Български
 Français
 Tiếng Việt
 中文
中文 বাংলা
বাংলা हिन्दी
 Čeština
 Українська
 Română

